
Thinking Like an Engineer: An Active Learning Approach (4th Edition)
4th Edition
ISBN: 9780134639673
Author: Elizabeth A. Stephan, David R. Bowman, William J. Park, Benjamin L. Sill, Matthew W. Ohland
Publisher: PEARSON
expand_more
expand_more
format_list_bulleted
Concept explainers
Videos
Textbook Question
Chapter 17, Problem 35ICA
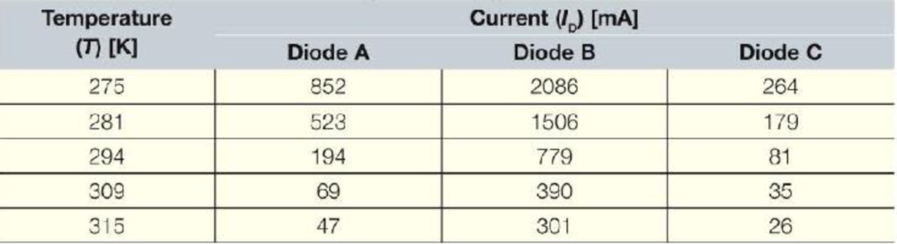
Three different diodes were tested: a constant voltage (0.65 volts) was held across each diode while the current through each was measured at various temperatures. The following data were obtained.
Create a proper plot of the data. Use polyfit to determine exponential models for each data set. For each model, add the trendline and the associated trendline equation to the graph
Expert Solution & Answer
Want to see the full answer?
Check out a sample textbook solution
Students have asked these similar questions
Qu. 17 Compute linear density values for [100] for silver (Ag). Express your answer in nm''.
. Round off the
answer to three significant figures.
Qu. 18 Compute linear density value for [111] direction for silver (Ag). Express your answer in nm'. Round off the answer to three significant figures.
Qu. 19 Compute planar density value for (100) plane for chromium (Cr). Express your answer in nm?.
Round off the answer to two significant figures.
Qu. 20 Compute planar density value for (110) plane for chromium (Cr). Express your answer in nm ≥ to four significant figures.
show all work please in material engineering
3-142
I need solutions
Chapter 17 Solutions
Thinking Like an Engineer: An Active Learning Approach (4th Edition)
Ch. 17.1 - a. Write an input statement to ask for the users...Ch. 17.1 - Prob. 2CCCh. 17.1 - Prob. 3CCCh. 17.1 - Prob. 4CCCh. 17.1 - a. Create an input dialog that asks users for...Ch. 17.2 - Assume that the variable M is stored in the...Ch. 17.2 - Prob. 7CCCh. 17.2 - Prob. 8CCCh. 17.3 - Create a proper plot of the function D = 50 3t...Ch. 17.3 - Comprehension Check 17-1 0 Create a proper plot of...
Ch. 17.3 - Prob. 11CCCh. 17.4 - Prob. 12CCCh. 17.4 - Prob. 13CCCh. 17.4 - Prob. 14CCCh. 17 - Write a MATLAB statement that results in the input...Ch. 17 - You are writing code that is part of a purchasing...Ch. 17 - For each question dialog described below, write a...Ch. 17 - For each input dialog described below, write a...Ch. 17 - For the following questions, assume z = 100/810....Ch. 17 - For the following questions, z = 100/810. Write...Ch. 17 - Assume that the following variables are stored in...Ch. 17 - Assume that a three-element row vector v already...Ch. 17 - The tiles on the space shuttle are constructed to...Ch. 17 - The specific gravity of acetic acid (vinegar) is...Ch. 17 - Write a MATLAB program that will allow a user to...Ch. 17 - Write a program that will allow the user to type a...Ch. 17 - In order to calculate the pressure in a flask,...Ch. 17 - Write a program that will allow the user to type...Ch. 17 - Use a question dialog to determine whether the...Ch. 17 - Write a MATLAB program that will ask users to...Ch. 17 - Write a program that asks a user to enter, one at...Ch. 17 - Joules first law, also known as the Joule effect,...Ch. 17 - Create a proper plot of the following set of...Ch. 17 - There is currently an effort in the United States...Ch. 17 - You want to create a graph showing the theoretical...Ch. 17 - In 1619, Johannes Kepler proposed his third law of...Ch. 17 - The decay of a radioactive isotope can be...Ch. 17 - Create a proper plot of the theoretical voltage...Ch. 17 - Plot the following functions as assigned by your...Ch. 17 - Plot the following functions as assigned by your...Ch. 17 - Prob. 28ICACh. 17 - Enter the following data into MATLAB. Graph the...Ch. 17 - If an object is heated, the temperature of the...Ch. 17 - The resistance of a typical carbon film resistor...Ch. 17 - Today, most traffic lights have a delayed green,...Ch. 17 - Cadmium sulfide (CdS) is a semiconducting material...Ch. 17 - Your supervisor has assigned you the task of...Ch. 17 - Three different diodes were tested: a constant...Ch. 17 - Design a program that will ask the user to enter...Ch. 17 - If a hot liquid in a container is left to cool,...Ch. 17 - You are an engineer working for M M / Mars...Ch. 17 - 1. The specific gravity of gold is 19.3. Write a...Ch. 17 - An unmanned X-43A scramjet test vehicle has...Ch. 17 - A rod on the surface of Jupiter's moon Callisto...Ch. 17 - The Eco-Marathon is an annual competition...Ch. 17 - Your company wishes to write a computer program...Ch. 17 - You are developing a program to record information...Ch. 17 - In a factory, various metal rods are forged and...Ch. 17 - Write a function and program to determine the mass...Ch. 17 - Write a program to calculate a temperature...Ch. 17 - You are part of an engineering firm on contract...Ch. 17 - You want to create a graph showing the...Ch. 17 - When one tries to stop a car, both the reaction...Ch. 17 - If an object is heated, the temperature of the...Ch. 17 - Capillary action draws liquid up a narrow tube...Ch. 17 - In a turbine, a device used for mixing, the power...Ch. 17 - A pilot tube is a device that measures the...Ch. 17 - Prob. 19RQCh. 17 - Download the weekly retail gasoline and diesel...Ch. 17 - A sample of the data provided in the Microsoft...Ch. 17 - An Excel file named DartTosses.xlsx has one...
Knowledge Booster


Learn more about
Need a deep-dive on the concept behind this application? Look no further. Learn more about this topic, mechanical-engineering and related others by exploring similar questions and additional content below.Similar questions
- 3-137arrow_forwardLarge wind turbines with a power capacity of 8 MW and blade span diameters of over 160 m areavailable for electric power generation. Consider a wind turbine with a blade span diameter of 120m installed at a site subjected to steady winds at 8.25 m/s. Taking the overall efficiency of thewind turbine to be 33 percent and the air density to be 1.25 kg/m3, determine the electric powergenerated by this wind turbine. Also, assuming steady winds of 8.25 m/s during a 24-h period,determine the amount of electric energy and the revenue generated per day for a unit price of$0.08/kWh for electricity.arrow_forwardThe basic barometer can be used to measure the height of a building. If the barometric readingsat the top and at the bottom of a building are 672 and 696 mmHg, respectively, determine theheight of the building. Take the densities of air and mercury to be 1.18 kg/m3 and 13,600 kg/m3,respectivelyarrow_forward
- A 7.25-hp (shaft) pump is used to raise water to an elevation of 17 m. If the mechanical efficiencyof the pump is 84 percent, determine the maximum volume flow rate of water.arrow_forwardConsider a double-fluid manometer attached to an air pipe shown below. If the specific gravity ofone fluid is 13.8, determine the specific gravity of the other fluid for the indicated absolutepressure of air. Take the atmospheric pressure to be 95 kPaarrow_forwardA race car enters the circular portion of a track that has a radius of 65 m. Disregard the 70 m in the picture. When the car enters the curve at point P, it is traveling with a speed of 120 km/h that is increasing at 5 m/s^2 . Three seconds later, determine the x and y components of velocity and acceleration of the car. I'm having trouble getting the correct y component of acceleration. all the other answers are correct. thank you!arrow_forward
- Figure: 06_P041 Copyright 2013 Pearson Education, publishing a Prentice Hall 2. Determine the force that the jaws J of the metal cutters exert on the smooth cable C if 100-N forces are applied to the handles. The jaws are pinned at E and A, and D and B. There is also a pin at F. 400 mm 15° 20 mm A 15° 15 D B 30 mm² 80 mm 20 mm 400 mm Figure: 06_P090 Copyright 2013 Pearson Education, publishing as Prentice Hall 15° 100 N 100 N 15°arrow_forwardA telemetry system is used to quantify kinematic values of a ski jumper immediately before the jumper leaves the ramp. According to the system r=560 ft , r˙=−105 ft/s , r¨=−10 ft/s2 , θ=25° , θ˙=0.07 rad/s , θ¨=0.06 rad/s2 Determine the velocity of the skier immediately before leaving the jump. The velocity of the skier immediately before leaving the jump along with its direction is ? I have 112.08 ft/s but can't seem to get the direction correct. Determine the acceleration of the skier at this instant. At this instant, the acceleration of the skier along with its direction is ? acceleration is 22.8 ft/s^2 but need help with direction. Need help with velocity direction and acceleration direction please.arrow_forwardFor Problems 18-22 (Table 7-27), design a V-belt drive. Specify the belt size, the sheave sizes, the number of belts, the actual output speed, and the center distance.arrow_forward
- only 21arrow_forwardonly 41arrow_forwardNormal and tangential components-relate to x-y coordinates A race car enters the circular portion of a track that has a radius of 65 m. When the car enters the curve at point P, it is traveling with a speed of 120 km/h that is increasing at 5 m/s^2 . Three seconds later, determine the x and y components of velocity and acceleration of the car. I need help with finding the y component of the total acceleration. I had put -32 but its incorrect. but i keep getting figures around that numberarrow_forward
arrow_back_ios
SEE MORE QUESTIONS
arrow_forward_ios
Recommended textbooks for you
 Elements Of ElectromagneticsMechanical EngineeringISBN:9780190698614Author:Sadiku, Matthew N. O.Publisher:Oxford University Press
 Mechanics of Materials (10th Edition)Mechanical EngineeringISBN:9780134319650Author:Russell C. HibbelerPublisher:PEARSON
 Thermodynamics: An Engineering ApproachMechanical EngineeringISBN:9781259822674Author:Yunus A. Cengel Dr., Michael A. BolesPublisher:McGraw-Hill Education
 Control Systems EngineeringMechanical EngineeringISBN:9781118170519Author:Norman S. NisePublisher:WILEY
 Mechanics of Materials (MindTap Course List)Mechanical EngineeringISBN:9781337093347Author:Barry J. Goodno, James M. GerePublisher:Cengage Learning
 Engineering Mechanics: StaticsMechanical EngineeringISBN:9781118807330Author:James L. Meriam, L. G. Kraige, J. N. BoltonPublisher:WILEY
Elements Of Electromagnetics
Mechanical Engineering
ISBN:9780190698614
Author:Sadiku, Matthew N. O.
Publisher:Oxford University Press
Mechanics of Materials (10th Edition)
Mechanical Engineering
ISBN:9780134319650
Author:Russell C. Hibbeler
Publisher:PEARSON
Thermodynamics: An Engineering Approach
Mechanical Engineering
ISBN:9781259822674
Author:Yunus A. Cengel Dr., Michael A. Boles
Publisher:McGraw-Hill Education
Control Systems Engineering
Mechanical Engineering
ISBN:9781118170519
Author:Norman S. Nise
Publisher:WILEY
Mechanics of Materials (MindTap Course List)
Mechanical Engineering
ISBN:9781337093347
Author:Barry J. Goodno, James M. Gere
Publisher:Cengage Learning
Engineering Mechanics: Statics
Mechanical Engineering
ISBN:9781118807330
Author:James L. Meriam, L. G. Kraige, J. N. Bolton
Publisher:WILEY
Fluid Mechanics - Viscosity and Shear Strain Rate in 9 Minutes!; Author: Less Boring Lectures;https://www.youtube.com/watch?v=_0aaRDAdPTY;License: Standard youtube license