
Concept explainers
Videos
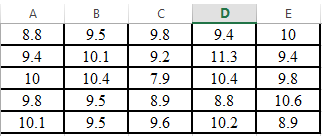
Given these data
| 8.8 | 9.5 | 9.8 | 9.4 | 10.0 |
| 9.4 | 10.1 | 9.2 | 11.3 | 9.4 |
| 10.0 | 10.4 | 7.9 | 10.4 | 9.8 |
| 9.8 | 9.5 | 8.9 | 8.8 | 10.6 |
| 10.1 | 9.5 | 9.6 | 10.2 | 8.9 |
Determine
(a) The Mean,
(b) The standard deviation,
(c) The Variance,
(d) The coefficient of variation, and
(e) The 95% confidence interval for the mean
(f) Construct a histogram using a range from 7.5 to 11.5 with intervals of 0.5
(a)
To calculate: The mean of the given data.
| 8.8 | 9.5 | 9.8 | 9.4 | 10 |
| 9.4 | 10.1 | 9.2 | 11.3 | 9.4 |
| 10 | 10.4 | 7.9 | 10.4 | 9.8 |
| 9.8 | 9.5 | 8.9 | 8.8 | 10.6 |
| 10.1 | 9.5 | 9.6 | 10.2 | 8.9 |
Answer to Problem 1P
Solution:
The mean of the given data is
Explanation of Solution
Given Information:
The data is,
| 8.8 | 9.5 | 9.8 | 9.4 | 10 |
| 9.4 | 10.1 | 9.2 | 11.3 | 9.4 |
| 10 | 10.4 | 7.9 | 10.4 | 9.8 |
| 9.8 | 9.5 | 8.9 | 8.8 | 10.6 |
| 10.1 | 9.5 | 9.6 | 10.2 | 8.9 |
Calculation:
The mean of the data can be found out with the help of excel as shown below,
Step 1. First put the data in the excel as shown below,
Step 2. Use AVERAGE command in excel as shown below,
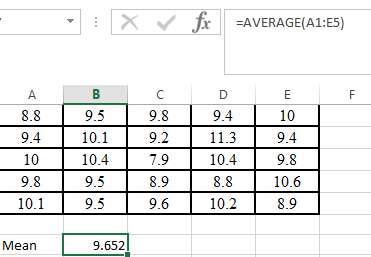
Hence, the mean of the given data is
(b)
To calculate: The standard deviation of the given data.
| 8.8 | 9.5 | 9.8 | 9.4 | 10 |
| 9.4 | 10.1 | 9.2 | 11.3 | 9.4 |
| 10 | 10.4 | 7.9 | 10.4 | 9.8 |
| 9.8 | 9.5 | 8.9 | 8.8 | 10.6 |
| 10.1 | 9.5 | 9.6 | 10.2 | 8.9 |
Answer to Problem 1P
Solution:
The standard deviation of the given data is
Explanation of Solution
Given Information:
The data is,
| 8.8 | 9.5 | 9.8 | 9.4 | 10 |
| 9.4 | 10.1 | 9.2 | 11.3 | 9.4 |
| 10 | 10.4 | 7.9 | 10.4 | 9.8 |
| 9.8 | 9.5 | 8.9 | 8.8 | 10.6 |
| 10.1 | 9.5 | 9.6 | 10.2 | 8.9 |
Calculation:
The standard deviation of the data can be found out with the help of excel as shown below,
Step 1. First put the data in the excel as shown below,
Step 2. Use STDEV command in excel as shown below,
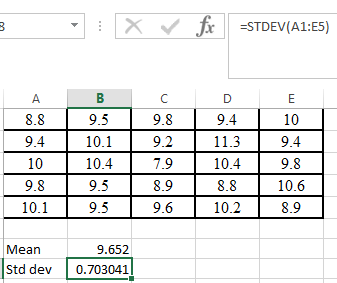
Hence, the standard deviation of the given data is
(c)
To calculate: The variance of the given data.
| 8.8 | 9.5 | 9.8 | 9.4 | 10 |
| 9.4 | 10.1 | 9.2 | 11.3 | 9.4 |
| 10 | 10.4 | 7.9 | 10.4 | 9.8 |
| 9.8 | 9.5 | 8.9 | 8.8 | 10.6 |
| 10.1 | 9.5 | 9.6 | 10.2 | 8.9 |
Answer to Problem 1P
Solution:
The variance of the given data is
Explanation of Solution
Given Information:
The data is,
| 8.8 | 9.5 | 9.8 | 9.4 | 10 |
| 9.4 | 10.1 | 9.2 | 11.3 | 9.4 |
| 10 | 10.4 | 7.9 | 10.4 | 9.8 |
| 9.8 | 9.5 | 8.9 | 8.8 | 10.6 |
| 10.1 | 9.5 | 9.6 | 10.2 | 8.9 |
Calculation:
The variance of the data can be found out with the help of excel as shown below,
Step 1. First put the data in the excel as shown below,
Step 2. Use VAR command in excel as shown below,
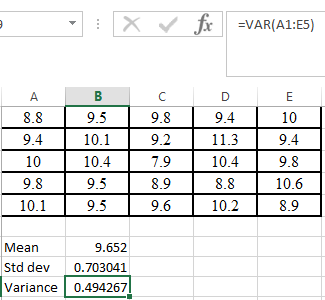
Hence, the variance of the given data is
(d)
To calculate: The coefficient of variation of the given data.
| 8.8 | 9.5 | 9.8 | 9.4 | 10 |
| 9.4 | 10.1 | 9.2 | 11.3 | 9.4 |
| 10 | 10.4 | 7.9 | 10.4 | 9.8 |
| 9.8 | 9.5 | 8.9 | 8.8 | 10.6 |
| 10.1 | 9.5 | 9.6 | 10.2 | 8.9 |
Answer to Problem 1P
Solution:
The coefficient of variation of the given data is
Explanation of Solution
Given Information:
The data is,
| 8.8 | 9.5 | 9.8 | 9.4 | 10 |
| 9.4 | 10.1 | 9.2 | 11.3 | 9.4 |
| 10 | 10.4 | 7.9 | 10.4 | 9.8 |
| 9.8 | 9.5 | 8.9 | 8.8 | 10.6 |
| 10.1 | 9.5 | 9.6 | 10.2 | 8.9 |
Formula used:
The coefficient of variation is
Calculation:
The coefficient of variation of the data can be found out with the help of excel as shown below,
Step 1. First put the data in the excel as shown below,
Step 2. Use coefficient of variation formula as shown below,
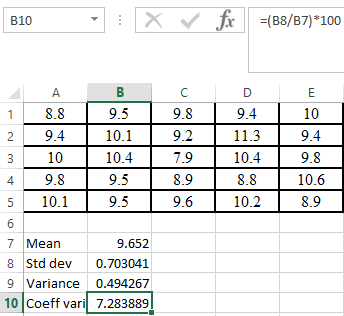
Hence, the coefficient of variation of the given data is
(e)
To calculate: The
| 8.8 | 9.5 | 9.8 | 9.4 | 10 |
| 9.4 | 10.1 | 9.2 | 11.3 | 9.4 |
| 10 | 10.4 | 7.9 | 10.4 | 9.8 |
| 9.8 | 9.5 | 8.9 | 8.8 | 10.6 |
| 10.1 | 9.5 | 9.6 | 10.2 | 8.9 |
Answer to Problem 1P
Solution:
The
Explanation of Solution
Given Information:
The data is,
| 8.8 | 9.5 | 9.8 | 9.4 | 10 |
| 9.4 | 10.1 | 9.2 | 11.3 | 9.4 |
| 10 | 10.4 | 7.9 | 10.4 | 9.8 |
| 9.8 | 9.5 | 8.9 | 8.8 | 10.6 |
| 10.1 | 9.5 | 9.6 | 10.2 | 8.9 |
Formula used:
The upper and lower range of
Where
Calculation:
Here,
The t calculator value for the given values is,
Use the formula to calculate the lower range,
And the upper range is,
Hence, the
(f)
To graph: The histogram of the given data by using a range from
| 8.8 | 9.5 | 9.8 | 9.4 | 10 |
| 9.4 | 10.1 | 9.2 | 11.3 | 9.4 |
| 10 | 10.4 | 7.9 | 10.4 | 9.8 |
| 9.8 | 9.5 | 8.9 | 8.8 | 10.6 |
| 10.1 | 9.5 | 9.6 | 10.2 | 8.9 |
Explanation of Solution
Given Information:
The data is,
| 8.8 | 9.5 | 9.8 | 9.4 | 10 |
| 9.4 | 10.1 | 9.2 | 11.3 | 9.4 |
| 10 | 10.4 | 7.9 | 10.4 | 9.8 |
| 9.8 | 9.5 | 8.9 | 8.8 | 10.6 |
| 10.1 | 9.5 | 9.6 | 10.2 | 8.9 |
Graph:
The histogram of the data can be found out with the help of excel as shown below,
Step 1. First put the data in the excel as shown below,
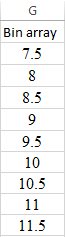
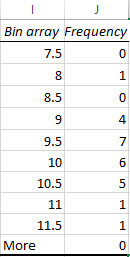
Step 2. Now insert the bin array range as shown below,
Step 3. Select on DATA, Data Analysis, Histogram and then OK.
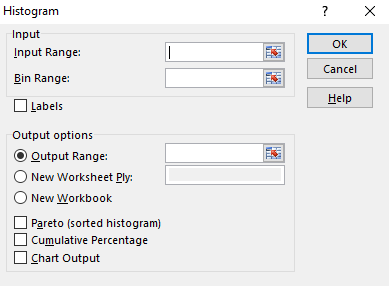
Step 4. Enter the input, Bin and output range as shown below,
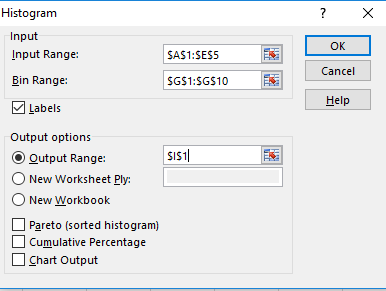
Step 5. The following result will appear.
Step 6. Now click on the insert and then column chart.
Interpretation:
It can be concluded from the histogram that 9.5 has repeated maximum time in the given data.
Want to see more full solutions like this?
Chapter 17 Solutions
Numerical Methods for Engineers


- Need detailed report without CHATGPT, accept if you can give with code and plots, previous reported Plots are required.arrow_forwardNeed detailed report without CHATGPT, accept if you can give with code and plots, previous reportedarrow_forward1. Which set of parametric equations is shown in the graph below? Explain your reasoning. a) x = t; y = t² b) x = = t²; y = t -3-2-1 5 4 3 2 1 12 3 2. Using the graph of f, a. determine whether dy/dt is positive or negative given that dx/dt is negative and b. determine whether dx/dt is positive or negative given that dy/dt is positive. Explain your reasoning. 2 f x 1 2 3 4arrow_forward
- Find the perimeter of the triangle. Express the perimeter using the same unit of measure that appears on the given sides. 9 ft 13 ft 6 ft The perimeter isarrow_forwardUse the formula for Pr to evaluate the following expression. 9P5 9P5 =☐arrow_forwardFind the volume of the figure. The volume of the figure is 3 m 3 m 3 marrow_forward
- Find the circumference and area of the circle. Express answers in terms of and then round to the nearest tenth. Find the circumference in terms of C= (Type an exact answer in terms of x.) Find the circumference rounded to the nearest tenth. C= Find the area in terms of A= (Type an exact answer in terms of x.) Find the area rounded to the nearest tenth. A= 10 cmarrow_forwardIn Exercises 62-64, sketch a reasonable graph that models the given situation. The number of hours of daylight per day in your hometown over a two-year period The motion of a diving board vibrating 10 inches in each direction per second just after someone has dived off The distance of a rotating beam of light from a point on a wallarrow_forwardThe manager of a fleet of automobiles is testing two brands of radial tires and assigns one tire of each brand at random to the two rear wheels of eight cars and runs the cars until the tires wear out. The data (in kilometers) follow. CAR BRAND1 BRAND2 DIFFERENCE = (BRAND1 - BF 1 36,925 33,018 3,907 2 45,300 43,280 2,020 3 36,240 35,500 740 4 32,100 31,200 900 5 37,210 37,015 195 6 48,360 46,800 1,560 7 38,200 37,810 390 8 33,500 33,215 285arrow_forward
- Diabetes and obesity are serious health concerns in the United States and much of the developed world. Measuring the amount of body fat a person carries is one way to monitor weight control progress, but measuring it accurately involves either expensive X-ray equipment or a pool in which to dunk the subject. Instead body mass index (BMI) is often used as a proxy for body fat because it is easy to measure: BMI = mass(kg)/(height(m))² = 703 mass(lb)/(height(in))². In a study of 15 men at TXST, both BMI and body fat were measured. Researchers imported the data into statistical software for analysis. A few values are missing from the output. Complete the table by filling in the missing values. Model Summary S R-sq % (three decimal places) (two decimal places. e.g. 12.3456%, enter 12.35) Analysis of Variance Source Model Error Total DF SS MS F P 17.600 0.001 DF: whole numbers SS or MS; three decimal places 34.810 Does a simple linear regression model seem reasonable in this situation?…arrow_forwardThe use of electromyostimulation (EMS) as a method to train healthy skeletal muscle is studied. EMS sessions consisted of 30 contractions (4-second duration, 85 Hz) and were carried out three times per week for three weeks on 17 ice hockey players. The 10-meter skating performance test showed a standard deviation of 0.90 seconds. Is there strong evidence to conclude that the standard deviation of performance time exceeds the historical value of 0.75 seconds? Use a = 0.05.arrow_forwardOne-Sample Z Test Test of М = 45 vs not === 45 The assumed standard deviation = 2.8 VARIABLE N MEAN STDEV SE MEAN X Instructions: 46.377 2.500 0.626 95% CI (,) Fill in the missing values. N: Round the answer to the nearest whole number. Cl: Round to three decimal places. Z: Round to two decimal places. P: Round to three decimal places.arrow_forward
 Glencoe Algebra 1, Student Edition, 9780079039897...AlgebraISBN:9780079039897Author:CarterPublisher:McGraw Hill
 Big Ideas Math A Bridge To Success Algebra 1: Stu...AlgebraISBN:9781680331141Author:HOUGHTON MIFFLIN HARCOURTPublisher:Houghton Mifflin Harcourt