
Concept explainers
Videos
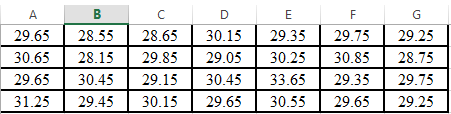
Given these data
| 29.65 | 28.55 | 28.65 | 30.15 | 29.35 | 29.75 | 29.25 |
| 30.65 | 28.15 | 29.85 | 29.05 | 30.25 | 30.85 | 28.75 |
| 29.65 | 30.45 | 29.15 | 30.45 | 33.65 | 29.35 | 29.75 |
| 31.25 | 29.45 | 30.15 | 29.65 | 30.55 | 29.65 | 29.25 |
Determine
(a) The Mean,
(b) The standard deviation,
(c) The variance,
(d) The coefficient of variation, and
(e) The 90% confidence interval for the mean
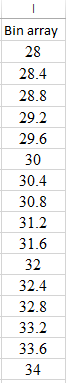
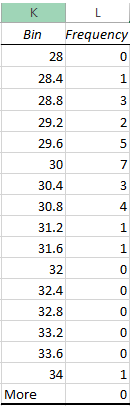
(f) Construct a histogram. Use a range from 28 to 34 with increments of 0.4
(g) Assuming that the distribution is normal and that your estimate of the standard deviation is valid, compute the range (that is, the lower and the upper values) that encompasses 68% of the readings.
Determine whether this is a valid estimate for the data in this problem.
(a)
To calculate: The mean of the given data.
| 29.65 | 28.55 | 28.65 | 30.15 | 29.35 | 29.75 | 29.25 |
| 30.65 | 28.15 | 29.85 | 29.05 | 30.25 | 30.85 | 28.75 |
| 29.65 | 30.45 | 29.15 | 30.45 | 33.65 | 29.35 | 29.75 |
| 31.25 | 29.45 | 30.15 | 29.65 | 30.55 | 29.65 | 29.25 |
Answer to Problem 2P
Solution:
The mean of the given data is
Explanation of Solution
Given Information:
The data is,
| 29.65 | 28.55 | 28.65 | 30.15 | 29.35 | 29.75 | 29.25 |
| 30.65 | 28.15 | 29.85 | 29.05 | 30.25 | 30.85 | 28.75 |
| 29.65 | 30.45 | 29.15 | 30.45 | 33.65 | 29.35 | 29.75 |
| 31.25 | 29.45 | 30.15 | 29.65 | 30.55 | 29.65 | 29.25 |
Calculation:
The mean of the data can be found out with the help of excel as shown below,
Step 1. First put the data in the excel as shown below,
Step 2. Use AVERAGE command in excel as shown below,
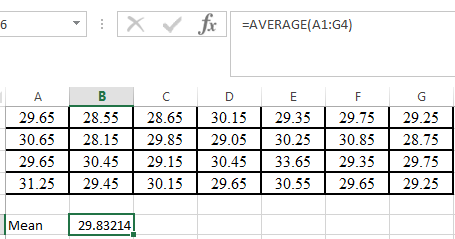
Hence, the mean of the given data is
(b)
To calculate: The standard deviation of the given data.
| 29.65 | 28.55 | 28.65 | 30.15 | 29.35 | 29.75 | 29.25 |
| 30.65 | 28.15 | 29.85 | 29.05 | 30.25 | 30.85 | 28.75 |
| 29.65 | 30.45 | 29.15 | 30.45 | 33.65 | 29.35 | 29.75 |
| 31.25 | 29.45 | 30.15 | 29.65 | 30.55 | 29.65 | 29.25 |
Answer to Problem 2P
Solution:
The standard deviation of the given data is
Explanation of Solution
Given Information:
The data is,
| 29.65 | 28.55 | 28.65 | 30.15 | 29.35 | 29.75 | 29.25 |
| 30.65 | 28.15 | 29.85 | 29.05 | 30.25 | 30.85 | 28.75 |
| 29.65 | 30.45 | 29.15 | 30.45 | 33.65 | 29.35 | 29.75 |
| 31.25 | 29.45 | 30.15 | 29.65 | 30.55 | 29.65 | 29.25 |
Calculation:
The standard deviation of the data can be found out with the help of excel as shown below,
Step 1. First put the data in the excel as shown below,
Step 2. Use STDEV command in excel as shown below,
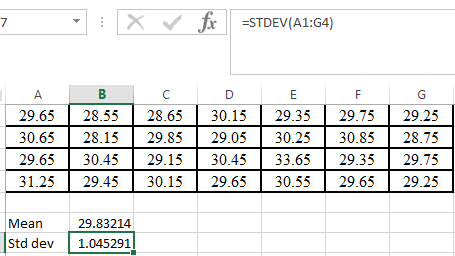
Hence, the standard deviation of the given data is
(c)
To calculate: The variance of the given data.
| 29.65 | 28.55 | 28.65 | 30.15 | 29.35 | 29.75 | 29.25 |
| 30.65 | 28.15 | 29.85 | 29.05 | 30.25 | 30.85 | 28.75 |
| 29.65 | 30.45 | 29.15 | 30.45 | 33.65 | 29.35 | 29.75 |
| 31.25 | 29.45 | 30.15 | 29.65 | 30.55 | 29.65 | 29.25 |
Answer to Problem 2P
Solution:
The variance of the given data is
Explanation of Solution
Given Information:
The data is,
| 29.65 | 28.55 | 28.65 | 30.15 | 29.35 | 29.75 | 29.25 |
| 30.65 | 28.15 | 29.85 | 29.05 | 30.25 | 30.85 | 28.75 |
| 29.65 | 30.45 | 29.15 | 30.45 | 33.65 | 29.35 | 29.75 |
| 31.25 | 29.45 | 30.15 | 29.65 | 30.55 | 29.65 | 29.25 |
Calculation:
The variance of the data can be found out with the help of excel as shown below,
Step 1. First put the data in the excel as shown below,
Step 2. Use VAR command in excel as shown below,
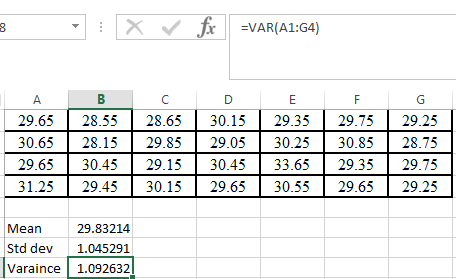
Hence, the variance of the given data is
(d)
To calculate: The coefficient of variation of the given data.
| 29.65 | 28.55 | 28.65 | 30.15 | 29.35 | 29.75 | 29.25 |
| 30.65 | 28.15 | 29.85 | 29.05 | 30.25 | 30.85 | 28.75 |
| 29.65 | 30.45 | 29.15 | 30.45 | 33.65 | 29.35 | 29.75 |
| 31.25 | 29.45 | 30.15 | 29.65 | 30.55 | 29.65 | 29.25 |
Answer to Problem 2P
Solution:
The coefficient of variation of the given data is
Explanation of Solution
Given Information:
The data is,
| 29.65 | 28.55 | 28.65 | 30.15 | 29.35 | 29.75 | 29.25 |
| 30.65 | 28.15 | 29.85 | 29.05 | 30.25 | 30.85 | 28.75 |
| 29.65 | 30.45 | 29.15 | 30.45 | 33.65 | 29.35 | 29.75 |
| 31.25 | 29.45 | 30.15 | 29.65 | 30.55 | 29.65 | 29.25 |
Formula used:
The coefficient of variation is
Calculation:
The coefficient of variation of the data can be found out with the help of excel as shown below,
Step 1. First put the data in the excel as shown below,
Step 2. Use the coefficient of variation formula as shown below,
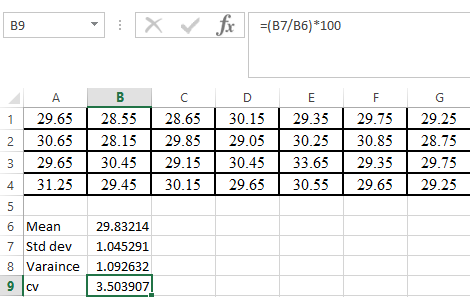
Hence, the coefficient of variation of the given data is
(e)
To calculate: The
| 29.65 | 28.55 | 28.65 | 30.15 | 29.35 | 29.75 | 29.25 |
| 30.65 | 28.15 | 29.85 | 29.05 | 30.25 | 30.85 | 28.75 |
| 29.65 | 30.45 | 29.15 | 30.45 | 33.65 | 29.35 | 29.75 |
| 31.25 | 29.45 | 30.15 | 29.65 | 30.55 | 29.65 | 29.25 |
Answer to Problem 2P
Solution:
The
Explanation of Solution
Given Information:
The data is,
| 29.65 | 28.55 | 28.65 | 30.15 | 29.35 | 29.75 | 29.25 |
| 30.65 | 28.15 | 29.85 | 29.05 | 30.25 | 30.85 | 28.75 |
| 29.65 | 30.45 | 29.15 | 30.45 | 33.65 | 29.35 | 29.75 |
| 31.25 | 29.45 | 30.15 | 29.65 | 30.55 | 29.65 | 29.25 |
Formula used:
The upper and lower range of confidence interval can be found out by,
Where
Calculation:
Here,
The t calculator value for the given values is,
Use the formula to calculate the lower range,
And the upper range is,
Hence, the
(f)
To graph: The histogram of the given data by using a range from
| 29.65 | 28.55 | 28.65 | 30.15 | 29.35 | 29.75 | 29.25 |
| 30.65 | 28.15 | 29.85 | 29.05 | 30.25 | 30.85 | 28.75 |
| 29.65 | 30.45 | 29.15 | 30.45 | 33.65 | 29.35 | 29.75 |
| 31.25 | 29.45 | 30.15 | 29.65 | 30.55 | 29.65 | 29.25 |
Explanation of Solution
Given Information:
The data is,
| 29.65 | 28.55 | 28.65 | 30.15 | 29.35 | 29.75 | 29.25 |
| 30.65 | 28.15 | 29.85 | 29.05 | 30.25 | 30.85 | 28.75 |
| 29.65 | 30.45 | 29.15 | 30.45 | 33.65 | 29.35 | 29.75 |
| 31.25 | 29.45 | 30.15 | 29.65 | 30.55 | 29.65 | 29.25 |
Graph:
The histogram of the data can be found out with the help of excel as shown below,
Step 1. First put the data in the excel as shown below,
Step 2. Now insert the bin array range as shown below,
Step 3. Select on DATA, Data Analysis, Histogram and then OK.
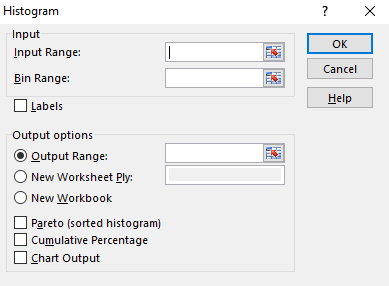
Step 4. Enter the input, Bin and output range as shown below,
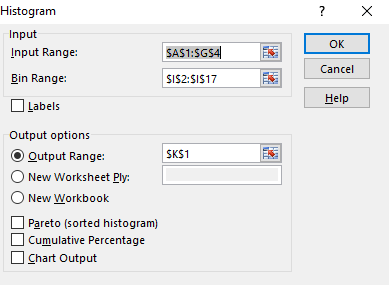
Step 5. The following result will appear.
Step 6. Now click on the insert and then column chart.
Interpretation:
It can be concluded from the histogram that 30 has repeated maximum time in the given data.
(g)
To calculate: The
| 29.65 | 28.55 | 28.65 | 30.15 | 29.35 | 29.75 | 29.25 |
| 30.65 | 28.15 | 29.85 | 29.05 | 30.25 | 30.85 | 28.75 |
| 29.65 | 30.45 | 29.15 | 30.45 | 33.65 | 29.35 | 29.75 |
| 31.25 | 29.45 | 30.15 | 29.65 | 30.55 | 29.65 | 29.25 |
Answer to Problem 2P
Solution:
The
Explanation of Solution
Given Information:
The data is,
| 29.65 | 28.55 | 28.65 | 30.15 | 29.35 | 29.75 | 29.25 |
| 30.65 | 28.15 | 29.85 | 29.05 | 30.25 | 30.85 | 28.75 |
| 29.65 | 30.45 | 29.15 | 30.45 | 33.65 | 29.35 | 29.75 |
| 31.25 | 29.45 | 30.15 | 29.65 | 30.55 | 29.65 | 29.25 |
Calculation:
As the
And,
From the Histogram, the data within this range
Thus, the percentage of data in this range is,
Which is higher than
Want to see more full solutions like this?
Chapter 17 Solutions
Numerical Methods for Engineers
Additional Math Textbook Solutions
College Algebra (Collegiate Math)
Precalculus
Thinking Mathematically (6th Edition)
Elementary Statistics ( 3rd International Edition ) Isbn:9781260092561
Intermediate Algebra (13th Edition)
Graphical Approach To College Algebra


- 7) Find an equation for the ellipse with foci at (0, ±7) and y-intercepts are +8.arrow_forward3) Find an equation for the parabola with a vertex at (1, 2) and focus at (1, 4). A) (x - 1)² = 8(y-2) C) (x - 1)² = -8(y - 2) B) (y - 2)² = -12(x − 1) - D) (y - 2)² = 12(x-1)arrow_forward2) Graph the equation. y² = 12x 5 10 -10 -5 5 + 10 xarrow_forward
 Glencoe Algebra 1, Student Edition, 9780079039897...AlgebraISBN:9780079039897Author:CarterPublisher:McGraw Hill
 Big Ideas Math A Bridge To Success Algebra 1: Stu...AlgebraISBN:9781680331141Author:HOUGHTON MIFFLIN HARCOURTPublisher:Houghton Mifflin Harcourt