
Concept explainers
Videos
Propose a structure consistent with each set of data.
a.
b.
c.
(a)
Interpretation: A structure consistent with the given set of data is to be predicted.
Concept introduction: Spectroscopy method is used to identify the structure of the molecule. It is based on the interactions between matter and electromagnetic radiations. Proton NMR spectroscopy identifies the number of hydrogen atoms present in a molecule and the nature of the functional group. The value of chemical peaks depends upon the chemical environment around the hydrogen atom.
Answer to Problem 17.55P
A structure consistent with the given set of data is shown below.
Explanation of Solution
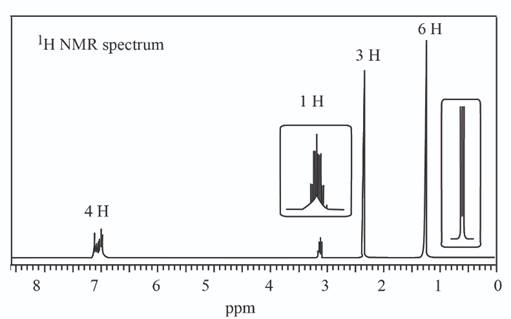
The given set of
Information from
The
Information from
The observed chemical shift value at
The observed chemical shift value at
The observed chemical shift value at
The observed chemical shift value at
The possible structure of the compound based on the above analysis is,

Figure 1
A structure consistent with the given set of data is shown in Figure 1.
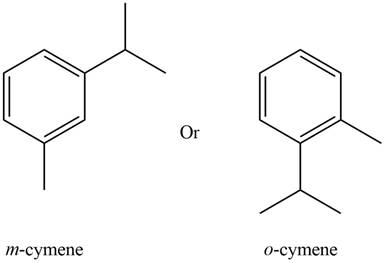
(b)
Interpretation: A structure consistent with the given set of data is to be predicted.
Concept introduction: Spectroscopy method is used to identify the structure of the molecule. It is based on the interactions between matter and electromagnetic radiations. Proton NMR spectroscopy identifies the number of hydrogen atoms present in a molecule and the nature of the functional group. The value of chemical peaks depends upon the chemical environment around the hydrogen atom.
Answer to Problem 17.55P
A structure consistent with the given set of data is shown below.
Explanation of Solution
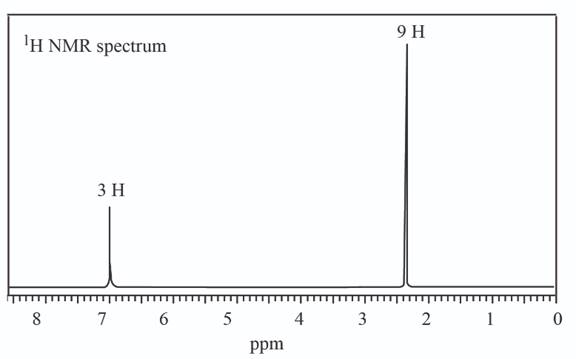
The given set of
Information from
Three signals are observed in
The
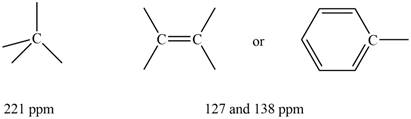
Figure 2
Information from
The observed chemical shift value at
The observed chemical shift value at
The possible structure of the compound based on the above analysis is,
Figure 3
A structure consistent with the given set of data is shown in Figure 3.
(c)
Interpretation: A structure consistent with the given set of data is to be predicted.
Concept introduction: Spectroscopy method is used to identify the structure of the molecule. It is based on the interactions between matter and electromagnetic radiations. Proton NMR spectroscopy identifies the number of hydrogen atoms present in a molecule and the nature of the functional group. The value of chemical peaks depends upon the chemical environment around the hydrogen atom.
Answer to Problem 17.55P
A structure consistent with the given set of data is shown below.
Explanation of Solution
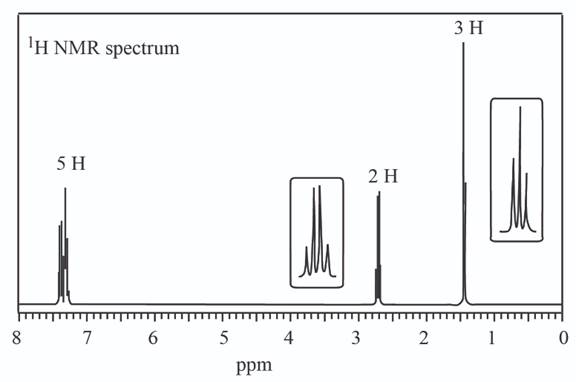
The given set of
Information from IR data:
The
Information from
The observed chemical shift value at
The observed chemical shift value at
The observed chemical shift value at
The possible structure of the compound based on the above analysis is,

Figure 4
A structure consistent with the given set of data is shown in Figure 4.
Want to see more full solutions like this?
Chapter 17 Solutions
Organic Chemistry


- helparrow_forwardThe temperature on a sample of pure X held at 1.25 atm and -54. °C is increased until the sample boils. The temperature is then held constant and the pressure is decreased by 0.42 atm. On the phase diagram below draw a path that shows this set of changes. pressure (atm) 2 0 0 200 400 temperature (K) Xarrow_forwardQUESTION: Answer Question 5: 'Calculating standard error of regression' STEP 1 by filling in all the empty green boxes *The values are all provided in the photo attached*arrow_forward
- pressure (atm) 3 The pressure on a sample of pure X held at 47. °C and 0.88 atm is increased until the sample condenses. The pressure is then held constant and the temperature is decreased by 82. °C. On the phase diagram below draw a path that shows this set of changes. 0 0 200 temperature (K) 400 аarrow_forwarder your payment details | bar xb Home | bartleby x + aleksogi/x/isl.exe/1o u-lgNskr7j8P3jH-1Qs_pBanHhviTCeeBZbufuBYT0Hz7m7D3ZcW81NC1d8Kzb4srFik1OUFhKMUXzhGpw7k1 O States of Matter Sketching a described thermodynamic change on a phase diagram 0/5 The pressure on a sample of pure X held at 47. °C and 0.88 atm is increased until the sample condenses. The pressure is then held constant and the temperature is decreased by 82. °C. On the phase diagram below draw a path that shows this set of changes. pressure (atm) 1 3- 0- 0 200 Explanation Check temperature (K) 400 X Q Search L G 2025 McGraw Hill LLC. All Rights Reserved Terms of Use Privacy Cearrow_forward5.arrow_forward
- 6.arrow_forward0/5 alekscgi/x/sl.exe/1o_u-IgNglkr7j8P3jH-IQs_pBaHhvlTCeeBZbufuBYTi0Hz7m7D3ZcSLEFovsXaorzoFtUs | AbtAURtkqzol 1HRAS286, O States of Matter Sketching a described thermodynamic change on a phase diagram The pressure on a sample of pure X held at 47. °C and 0.88 atm is increased until the sample condenses. The pressure is then held constant and the temperature is decreased by 82. °C. On the phase diagram below draw a path that shows this set of changes. 3 pressure (atm) + 0- 0 5+ 200 temperature (K) 400 Explanation Check X 0+ F3 F4 F5 F6 F7 S 2025 McGraw Hill LLC All Rights Reserved. Terms of Use Privacy Center Accessibility Q Search LUCR + F8 F9 F10 F11 F12 * % & ( 5 6 7 8 9 Y'S Dele Insert PrtSc + Backsarrow_forward5.arrow_forward
- 9arrow_forwardalekscgi/x/lsl.exe/1o_u-IgNslkr7j8P3jH-IQs_pBanHhvlTCeeBZbufu BYTI0Hz7m7D3ZS18w-nDB10538ZsAtmorZoFusYj2Xu9b78gZo- O States of Matter Sketching a described thermodynamic change on a phase diagram 0/5 The pressure on a sample of pure X held at 47. °C and 0.88 atm is increased until the sample condenses. The pressure is then held constant and the temperature is decreased by 82. °C. On the phase diagram below draw a path that shows this set of changes. pressure (atm) 3- 200 temperature (K) Explanation Chick Q Sowncharrow_forward0+ aleksog/x/lsl.exe/1ou-lgNgkr7j8P3H-IQs pBaHhviTCeeBZbufuBYTOHz7m7D3ZStEPTBSB3u9bsp3Da pl19qomOXLhvWbH9wmXW5zm O States of Matter Sketching a described thermodynamic change on a phase diagram 0/5 Gab The temperature on a sample of pure X held at 0.75 atm and -229. °C is increased until the sample sublimes. The temperature is then held constant and the pressure is decreased by 0.50 atm. On the phase diagram below draw a path that shows this set of changes. F3 pressure (atm) 0- 0 200 Explanation temperature (K) Check F4 F5 ☀+ Q Search Chill Will an 9 ENG F6 F7 F8 F9 8 Delete F10 F11 F12 Insert PrtSc 114 d Ararrow_forward

 Macroscale and Microscale Organic ExperimentsChemistryISBN:9781305577190Author:Kenneth L. Williamson, Katherine M. MastersPublisher:Brooks Cole