Concept explainers
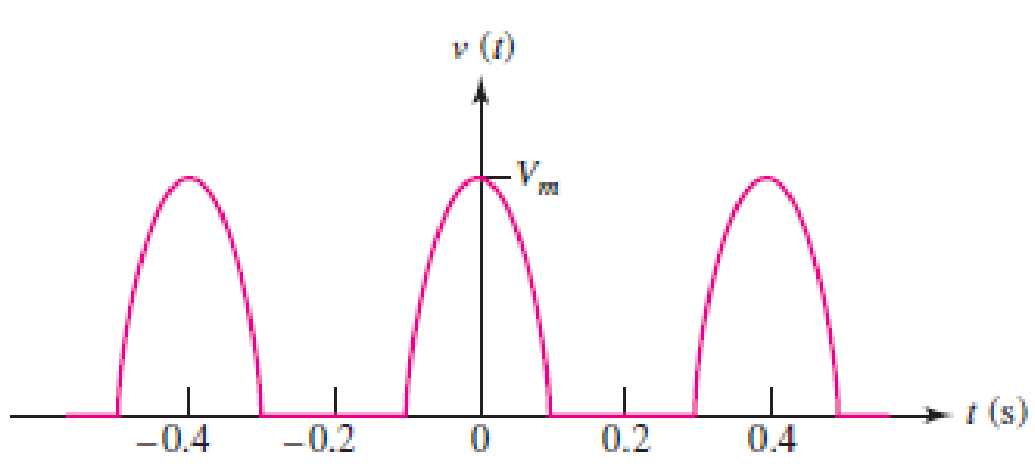
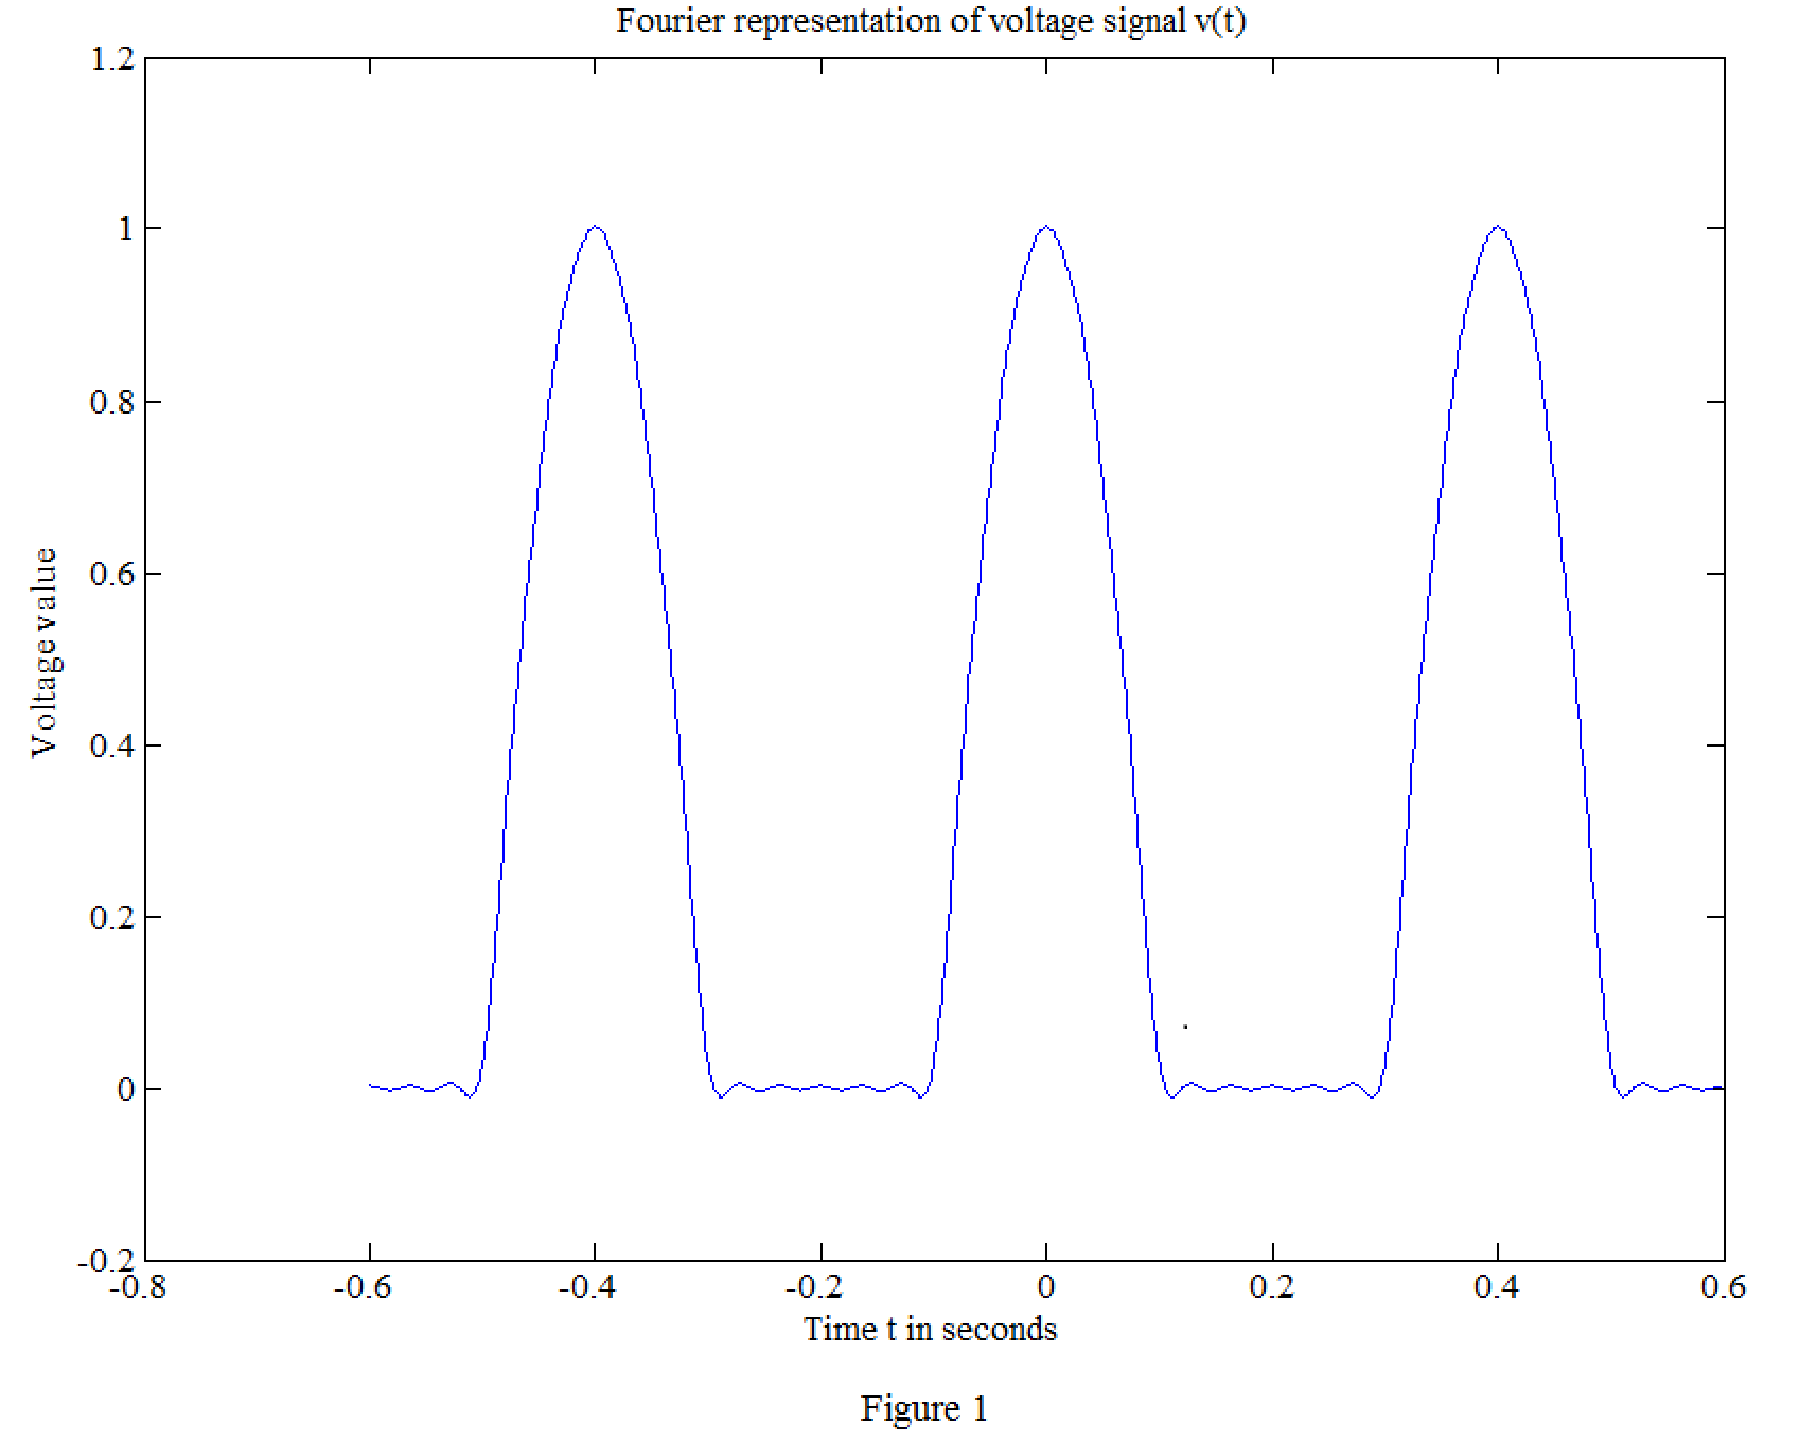
A “half-sinusoidal” waveform is shown in Fig. 17.31, which is the output of a half-wave rectifier used to help convert a sinusoidal input to dc. Find the Fourier series representation and plot the signal and Fourier series representation for n = 10 terms.

■ FIGURE 17.31
Find the Fourier series coefficients
Answer to Problem 11E
The values of the Fourier series coefficients
Explanation of Solution
Given data:
Refer to Figure 17.31 in the textbook.
Formula used:
Write the general expression for Fourier series expansion.
Write the general expression for Fourier series coefficient
Write the general expression for Fourier series coefficient
Write the general expression for Fourier series coefficient
Write the expression to calculate the fundamental angular frequency.
Here,
Calculation:
In the given Figure 17.31, the time period is
The function
Substitute 0.4 for T in equation (5) to find
Applying equation (6) in equation (2) to find
Simplify the above equation as follows,
For half wave symmetry and even symmetry,
For all values of ‘n’,
Applying equation (6) in equation (3) to find the value of coefficient
Consider the function,
Consider,
On differentiating the above expression,
Equation (8) will be follows,
In the above equation, consider,
By applying linearity,
In equation (10),
consider,
Let,
Equation (11) will be as follows,
Similarly, in equation (10),
consider,
Let,
Equation (12) will be as follows,
Substitute the values of m and l in equation (10) as follows,
Substitute the value of y in equation (9) as follows,
Therefore,
On applying the limits,
Simplify the equation as follows,
Simplify the equation as follows,
Substitute the value of
Substitute the value of
Representing through
By considering
Matlab code for the signal
t=linspace(-0.6,0.6,1000); % vector for time over 1000 points.
Vm=1;
v0=Vm/(pi); % constant.
for i=1:1000;
sum=0;
sum=sum+ 0.5*cos(5*pi*t(i)) + (2/(3*pi))*cos(10*pi*t(i)) - (2/(15*pi))*cos(20*pi*t(i)) + (2/(35*pi))*cos(30*pi*t(i)) - (2/(63*pi))*cos(40*pi*t(i)) + (2/(99*pi))*cos(50*pi*t(i));
vt(i)=v0+sum;
end
plot(t,vt)
xlabel('Time t in seconds')
ylabel('Voltage value')
title('Fourier representation of voltage signal v(t)')
Matlab output:
The Fourier representation of voltage signal

Conclusion:
Thus, the values of the Fourier series coefficients
Want to see more full solutions like this?
Chapter 17 Solutions
Engineering Circuit Analysis
Additional Engineering Textbook Solutions
Vector Mechanics For Engineers
Modern Database Management
Starting Out with Programming Logic and Design (5th Edition) (What's New in Computer Science)
Introduction To Programming Using Visual Basic (11th Edition)
Database Concepts (8th Edition)
Electric Circuits. (11th Edition)
- find inverse LT for the following functions 1- [0.2s+1.4] s2+1.96. 2. L-1 5s+1 Ls2-25. 4s+32 3. L- L(s2-16).arrow_forwardQ Figurel shows the creation of the Frequency Reuse Pattern Using the Cluster Size K (A) illustrates how i and j can be used to locate a co-channel cell. Juster Cluster CB Cluster 2 X=7(i=2,j=1)arrow_forwardDon't use ai to answer I will report you answerarrow_forward
- Q2. For the transformer shown in Fig. 1. A. Plot the winding connection for the transformer and justify your answer. (4M) B. If the transformer is adopted in 12 pulse diode rectifier, where two-series connected bridge rectifiers are used to supply a highly inductive load with 100 A. (i) Select a suitable turns ratio for the transformer (ii) Plot the line current of each winding ( secondary + primary) showing the current magnitude at each interval (iii) Use Fourier Page 1 of 3 analysis to obtain the Fourier series of all line currents then calculate the THD of the input current. (8=0° (16M) (Y) = 30° Fig. 1 P. I v Iarrow_forwardQ2. For the transformer shown in Fig.1, A. Find the phase shift between the primary and star-connected secondary. B. If the transformer is adopted in a 12-pulse diode rectifier, where a two-series connected bridge rectifier is connected in series and supplies a highly inductive load (i) Select a suitable turns ratio for the transformer (ii) Plot the line current of each winding (secondary + primary). (iii)Using Fourier analysis to obtain the Fourier series of all line currents, then calculate the THD of the input current. (iv) Draw the output voltage of the first and second rectifiers and give the relation of the total output voltage. N2 B C Fig. 1 N3 aarrow_forwardQ2.A. It is planned to use the transformer shown in Fig. 1, a 12-pulse rectifier. Each secondary is connected to three phase controlled bridge rectifier. The two rectifiers are connected in series to supply a highly inductive load. 1. Based on the phasor relationship between different windings. If suitable turns ratio is selected, is it possible to use this transformer to produce 12 pulse output voltage? Show the reason behind your answer. 2. Assuming this arrangement is possible to be used in 12-pulse rectifier, draw the output voltage of the 1st and 2nd rectifier and give the relation of the total output voltage. 3. Use the Fourier analysis to show the harmonics in all line currents of the transformer. A B in C Fig. 1 b la a 2 b.arrow_forward
 Introductory Circuit Analysis (13th Edition)Electrical EngineeringISBN:9780133923605Author:Robert L. BoylestadPublisher:PEARSON
 Delmar's Standard Textbook Of ElectricityElectrical EngineeringISBN:9781337900348Author:Stephen L. HermanPublisher:Cengage Learning
 Programmable Logic ControllersElectrical EngineeringISBN:9780073373843Author:Frank D. PetruzellaPublisher:McGraw-Hill Education
 Fundamentals of Electric CircuitsElectrical EngineeringISBN:9780078028229Author:Charles K Alexander, Matthew SadikuPublisher:McGraw-Hill Education
 Electric Circuits. (11th Edition)Electrical EngineeringISBN:9780134746968Author:James W. Nilsson, Susan RiedelPublisher:PEARSON
 Engineering ElectromagneticsElectrical EngineeringISBN:9780078028151Author:Hayt, William H. (william Hart), Jr, BUCK, John A.Publisher:Mcgraw-hill Education,


