Bundle: Introduction to General, Organic and Biochemistry, 11th + OWLv2, 4 terms (24 months) Printed Access Card
11th Edition
ISBN: 9781305705159
Author: Frederick A. Bettelheim, William H. Brown, Mary K. Campbell, Shawn O. Farrell, Omar Torres
Publisher: Cengage Learning
expand_more
expand_more
format_list_bulleted
Concept explainers
Videos
Textbook Question
Chapter 16.4, Problem 16.4P
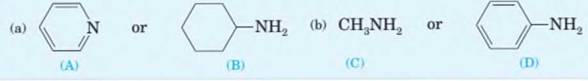
Problem 16-4 Select the stronger base from each pair of
Expert Solution & Answer

Trending nowThis is a popular solution!

Students have asked these similar questions
QUESTION: Answer Question 5: 'Calculating standard error of regression' STEP 1 by filling in all the empty green boxes
*The values are all provided in the photo attached*
pressure (atm)
3
The pressure on a sample of pure X held at 47. °C and 0.88 atm is increased until the sample condenses. The pressure is then held constant and the
temperature is decreased by 82. °C. On the phase diagram below draw a path that shows this set of changes.
0
0
200
temperature (K)
400
а
er your payment details | bar xb Home | bartleby
x +
aleksogi/x/isl.exe/1o u-lgNskr7j8P3jH-1Qs_pBanHhviTCeeBZbufuBYT0Hz7m7D3ZcW81NC1d8Kzb4srFik1OUFhKMUXzhGpw7k1
O States of Matter
Sketching a described thermodynamic change on a phase diagram
0/5
The pressure on a sample of pure X held at 47. °C and 0.88 atm is increased until the sample condenses. The pressure is then held constant and the
temperature is decreased by 82. °C. On the phase diagram below draw a path that shows this set of changes.
pressure (atm)
1
3-
0-
0
200
Explanation
Check
temperature (K)
400
X
Q Search
L
G
2025 McGraw Hill LLC. All Rights Reserved Terms of Use Privacy Ce
Chapter 16 Solutions
Bundle: Introduction to General, Organic and Biochemistry, 11th + OWLv2, 4 terms (24 months) Printed Access Card
Ch. 16.1 - Problem 16-1 How many hydrogen atoms does...Ch. 16.2 - Problem 16-2 Write a structural formula for each...Ch. 16.2 - Prob. 16.3PCh. 16.4 - Problem 16-4 Select the stronger base from each...Ch. 16.5 - Prob. 16.5PCh. 16 - 16-6 Answer true or false. te/7-Butylamine is a 3°...Ch. 16 - Prob. 16.7PCh. 16 - Prob. 16.8PCh. 16 - 16-9 In what way are pyridine and pyrimidine...Ch. 16 - Prob. 16.10P
Ch. 16 - Prob. 16.11PCh. 16 - Prob. 16.12PCh. 16 - 16-13 Classify each amino group as primary,...Ch. 16 - Prob. 16.14PCh. 16 - 16-15 There are eight primary amines with the...Ch. 16 - Prob. 16.16PCh. 16 - 16-17 Propylamine (bp 48°C), ethylmethylamine (bp...Ch. 16 - 16-18 Account for the fact that 1-butanamine (bp...Ch. 16 - 16-19 2-Me thy 1 propane (bp -12°C), 2-propanol...Ch. 16 - Prob. 16.20PCh. 16 - Prob. 16.21PCh. 16 - Prob. 16.22PCh. 16 - Prob. 16.23PCh. 16 - Prob. 16.24PCh. 16 - Prob. 16.25PCh. 16 - 16-26 The p/fb of amphetamine is approximately 3.2...Ch. 16 - 16-27 Guanidine, p/Ca 13.6, is a very strong base,...Ch. 16 - 16-28 Following is the structural formula of...Ch. 16 - Prob. 16.29PCh. 16 - Prob. 16.30PCh. 16 - Prob. 16.31PCh. 16 - 16*32 Many tumors of the breast are correlated...Ch. 16 - Prob. 16.33PCh. 16 - Prob. 16.34PCh. 16 - 16-35 (Chemical Connections 16B ) What is an...Ch. 16 - Prob. 16.36PCh. 16 - Prob. 16.37PCh. 16 - Prob. 16.38PCh. 16 - Prob. 16.39PCh. 16 - Prob. 16.40PCh. 16 - Prob. 16.41PCh. 16 - Prob. 16.42PCh. 16 - Prob. 16.43PCh. 16 - Prob. 16.44PCh. 16 - Prob. 16.45PCh. 16 - 16-46 Arrange these three compounds in order of...Ch. 16 - Prob. 16.47PCh. 16 - Prob. 16.48PCh. 16 - Prob. 16.49PCh. 16 - Prob. 16.50PCh. 16 - Prob. 16.51PCh. 16 - Prob. 16.52PCh. 16 - Prob. 16.53PCh. 16 - 16-54 Several poisonous plants, including Atropa...Ch. 16 - Prob. 16.55PCh. 16 - Prob. 16.56PCh. 16 - Prob. 16.57PCh. 16 - 16-58 Following is a structural formula of...Ch. 16 - Prob. 16.59P
Knowledge Booster


Learn more about
Need a deep-dive on the concept behind this application? Look no further. Learn more about this topic, chemistry and related others by exploring similar questions and additional content below.Similar questions
- 5.arrow_forward6.arrow_forward0/5 alekscgi/x/sl.exe/1o_u-IgNglkr7j8P3jH-IQs_pBaHhvlTCeeBZbufuBYTi0Hz7m7D3ZcSLEFovsXaorzoFtUs | AbtAURtkqzol 1HRAS286, O States of Matter Sketching a described thermodynamic change on a phase diagram The pressure on a sample of pure X held at 47. °C and 0.88 atm is increased until the sample condenses. The pressure is then held constant and the temperature is decreased by 82. °C. On the phase diagram below draw a path that shows this set of changes. 3 pressure (atm) + 0- 0 5+ 200 temperature (K) 400 Explanation Check X 0+ F3 F4 F5 F6 F7 S 2025 McGraw Hill LLC All Rights Reserved. Terms of Use Privacy Center Accessibility Q Search LUCR + F8 F9 F10 F11 F12 * % & ( 5 6 7 8 9 Y'S Dele Insert PrtSc + Backsarrow_forward
- 5.arrow_forward9arrow_forwardalekscgi/x/lsl.exe/1o_u-IgNslkr7j8P3jH-IQs_pBanHhvlTCeeBZbufu BYTI0Hz7m7D3ZS18w-nDB10538ZsAtmorZoFusYj2Xu9b78gZo- O States of Matter Sketching a described thermodynamic change on a phase diagram 0/5 The pressure on a sample of pure X held at 47. °C and 0.88 atm is increased until the sample condenses. The pressure is then held constant and the temperature is decreased by 82. °C. On the phase diagram below draw a path that shows this set of changes. pressure (atm) 3- 200 temperature (K) Explanation Chick Q Sowncharrow_forward
- 0+ aleksog/x/lsl.exe/1ou-lgNgkr7j8P3H-IQs pBaHhviTCeeBZbufuBYTOHz7m7D3ZStEPTBSB3u9bsp3Da pl19qomOXLhvWbH9wmXW5zm O States of Matter Sketching a described thermodynamic change on a phase diagram 0/5 Gab The temperature on a sample of pure X held at 0.75 atm and -229. °C is increased until the sample sublimes. The temperature is then held constant and the pressure is decreased by 0.50 atm. On the phase diagram below draw a path that shows this set of changes. F3 pressure (atm) 0- 0 200 Explanation temperature (K) Check F4 F5 ☀+ Q Search Chill Will an 9 ENG F6 F7 F8 F9 8 Delete F10 F11 F12 Insert PrtSc 114 d Ararrow_forwardx + LEKS: Using a phase diagram a X n/alekscgi/x/lsl.exe/10_u-IgNsikr7j8P3jH-IQs_pBan HhvlTCeeBZbufu BYTI0Hz7m7D3ZcHYUt80XL-5alyVpw ○ States of Matter Using a phase diagram to find a phase transition temperature or pressure Use the phase diagram of Substance X below to find the melting point of X when the pressure above the solid is 1.1 atm. pressure (atm) 16 08- solid liquid- 0 200 400 gas 600 temperature (K) Note: your answer must be within 25 °C of the exact answer to be graded correct. × 5arrow_forwardS: Using a phase diagram leksogi/x/sl.exe/1ou-IgNs kr 7j8P3jH-IQs_pBan HhvTCeeBZbufuBYTI0Hz7m7D3ZdHYU+80XL-5alyVp O States of Matter Using a phase diagram to find a phase transition temperature or pressure se the phase diagram of Substance X below to find the boiling point of X when the pressure on the liquid is 1.6 atm. pressure (atm) 32- 16- solid liquid 0. gas 100 200 temperature (K) 300 Note: your answer must be within 12.5 °C of the exact answer to be graded correct. 10 Explanation Check § Q Search J 2025 McGraw Hill LLC. All Rights Researrow_forward
- 151.2 254.8 85.9 199.6 241.4 87.6 242.5 186.4 155.8 257.1 242.9 253.3 256.0 216.6 108.7 239.0 149.7 236.4 152.1 222.7 148.7 278.2 268.7 234.4 262.7 283.2 143.6 QUESTION: Using this group of data on salt reduced tomato sauce concentration readings answer the following questions: 1. 95% Cl Confidence Interval (mmol/L) 2. [Na+] (mg/100 mL) 3. 95% Na+ Confidence Interval (mg/100 mL)arrow_forwardResults Search Results Best Free Coursehero Unloc xb Success Confirmation of Q x O Google Pas alekscgi/x/lsl.exe/1o_u-IgNslkr 7j8P3jH-IQs_pBanHhvlTCeeBZbufu BYTI0Hz7m7D3ZcHYUt80XL-5alyVpwDXM TEZayFYCavJ17dZtpxbFD0Qggd1J O States of Matter Using a phase diagram to find a phase transition temperature or pressure Gabr 3/5 he pressure above a pure sample of solid Substance X at 101. °C is lowered. At what pressure will the sample sublime? Use the phase diagram of X below to nd your answer. pressure (atm) 24- 12 solid liquid gas 200 400 temperature (K) 600 ote: your answer must be within 0.15 atm of the exact answer to be graded correct. atm Thanation Check © 2025 McGraw Hill LLC. All Rights Reserved. Terms of Use | Privacy Center I Q Search L³ ملةarrow_forward301.7 348.9 193.7 308.6 339.5 160.6 337.7 464.7 223.5 370.5 326.6 327.5 336.1 317.9 203.8 329.8 221.9 331.7 211.7 309.6 223.4 353.7 334.6 305.6 340.0 304.3 244.7 QUESTION: Using this group of data on regular tomato sauce concentration readings answer the following questions: 1. 95% Cl Confidence Interval (mmol/L) 2. [Na+] (mg/100 mL) 3. 95% Na+ Confidence Interval (mg/100 mL)arrow_forward
arrow_back_ios
SEE MORE QUESTIONS
arrow_forward_ios
Recommended textbooks for you
 Introduction to General, Organic and BiochemistryChemistryISBN:9781285869759Author:Frederick A. Bettelheim, William H. Brown, Mary K. Campbell, Shawn O. Farrell, Omar TorresPublisher:Cengage Learning
Introduction to General, Organic and Biochemistry
Chemistry
ISBN:9781285869759
Author:Frederick A. Bettelheim, William H. Brown, Mary K. Campbell, Shawn O. Farrell, Omar Torres
Publisher:Cengage Learning
General Chemistry | Acids & Bases; Author: Ninja Nerd;https://www.youtube.com/watch?v=AOr_5tbgfQ0;License: Standard YouTube License, CC-BY