
Introductory Statistics, Books a la Carte Plus NEW MyLab Statistics with Pearson eText -- Access Card Package (10th Edition)
10th Edition
ISBN: 9780134270364
Author: Neil A. Weiss
Publisher: PEARSON
expand_more
expand_more
format_list_bulleted
Videos
Textbook Question
Chapter 16.3, Problem 40E
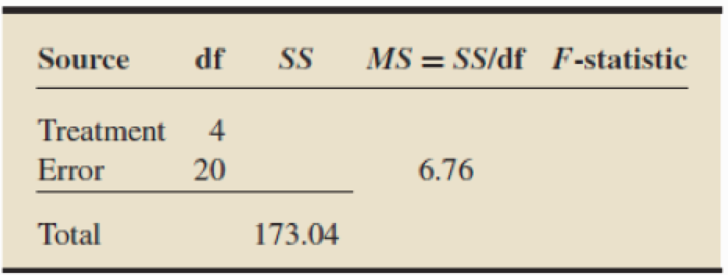
In Exercises 16.38-16.41 fill in the missing entries in the partially completed one-way ANOVA tables.
16.40
Expert Solution & Answer
Want to see the full answer?
Check out a sample textbook solution
Students have asked these similar questions
Une Entreprise œuvrant dans le domaine du multividéo donne l'opportunité à ses
programmeurs-analystes d'évaluer la performance des cadres supérieurs.
Voici les résultats obtenues (sur une échelle de 10 à 50) où 50 représentent une
excellente performance. 10 programmeurs furent sélectionnés au hazard pour
évaluer deux cadres. Un rapport Excel est également fourni.
Programmeurs
Cadre A Cadre B
1
34
36
2
32
34
3
18
19
33
38
19
21
21
23
7
35
34
8
20
20
9
34
34
10
36
34
Test d'égalité des espérances: observations pairées
A television news channel samples 25 gas stations from its local area and uses the results to estimate the average gas price for the state. What’s wrong with its margin of error?
You’re fed up with keeping Fido locked inside, so you conduct a mail survey to find out people’s opinions on the new dog barking ordinance in a certain city. Of the 10,000 people who receive surveys, 1,000 respond, and only 80 are in favor of it. You calculate the margin of error to be 1.2 percent. Explain why this reported margin of error is misleading.
Chapter 16 Solutions
Introductory Statistics, Books a la Carte Plus NEW MyLab Statistics with Pearson eText -- Access Card Package (10th Edition)
Ch. 16.1 - How do we identify an F-distribution and its...Ch. 16.1 - How many degrees of freedom does an F-curve have?...Ch. 16.1 - What symbol is used to denote the F-value having...Ch. 16.1 - Using the F-notation, identify the F-value having...Ch. 16.1 - An F-curve has df = (12, 7). What is the number of...Ch. 16.1 - An F-curve has df = (8, 19). What is the number of...Ch. 16.1 - In Exercises 16.716.10, use Table VIII in Appendix...Ch. 16.1 - Prob. 8ECh. 16.1 - Prob. 9ECh. 16.1 - Prob. 10E
Ch. 16.2 - One-way ANOVA is a procedure for comparing the...Ch. 16.2 - If we define s=MSE, of which parameter is s an...Ch. 16.2 - Explain the reason for the word variance in the...Ch. 16.2 - For a one-way ANOVA test, suppose that, in...Ch. 16.2 - Regarding one-way ANOVA, fill in the blanks in...Ch. 16.2 - Regarding one-way ANOVA, fill in the blanks in...Ch. 16.2 - Regarding one-way ANOVA, fill in the blanks in...Ch. 16.2 - Explain the logic behind one-way ANOVA.Ch. 16.2 - What does the term one-way signify in the phrase...Ch. 16.2 - Figure 16.6 shows side-by-side boxplots of...Ch. 16.2 - Figure 16.7 shows side-by-side boxplots of...Ch. 16.2 - Discuss two methods for checking the assumptions...Ch. 16.2 - In one-way ANOVA, what is the residual of an...Ch. 16.2 - In Exercises 16.24-16.29, we have provided data...Ch. 16.2 - In Exercises 16.24-16.29. we have provided data...Ch. 16.2 - In Exercises 16.24-16.29, we have provided data...Ch. 16.2 - In Exercises 16.24-16.29, we have provided data...Ch. 16.2 - In Exercises 16.24-16.29, we have provided data...Ch. 16.2 - In Exercises 16.24-16.29, we have provided data...Ch. 16.2 - Show that, for two populations, MSE=sp2, where is...Ch. 16.2 - Suppose that the variable under consideration is...Ch. 16.3 - Suppose that a one-way ANOVA is being performed to...Ch. 16.3 - We stated earlier that a one-way ANOVA test is...Ch. 16.3 - Following are the notations for the three sums of...Ch. 16.3 - State the one-way ANOVA identity, and interpret...Ch. 16.3 - True or false: If you know any two of the three...Ch. 16.3 - In each part, specify what type of analysis you...Ch. 16.3 - Prob. 38ECh. 16.3 - In Exercises 16.38-16.41, fill in the missing...Ch. 16.3 - In Exercises 16.38-16.41 fill in the missing...Ch. 16.3 - Prob. 41ECh. 16.3 - In Exercises 16.42-16.47. wt provide data from...Ch. 16.3 - In Exercises 16.42-16.47, we provide data from...Ch. 16.3 - Prob. 44ECh. 16.3 - Prob. 45ECh. 16.3 - Prob. 46ECh. 16.3 - Prob. 47ECh. 16.3 - Prob. 48ECh. 16.3 - Copepod Cuisine. Copepods are tiny crustaceans...Ch. 16.3 - In Exercises 16.48-16.53, apply Procedure 16.1 on...Ch. 16.3 - Staph Infections. In the article Using EDE, ANOVA...Ch. 16.3 - Prob. 52ECh. 16.3 - Prob. 53ECh. 16.3 - Prob. 54ECh. 16.3 - Prob. 55ECh. 16.3 - In Exercises 16.54-16.59, use the technology of...Ch. 16.3 - Prob. 57ECh. 16.3 - In Exercises 16.54-16.59, use. the technology of...Ch. 16.3 - Prob. 59ECh. 16.3 - Prob. 60ECh. 16.3 - Prob. 61ECh. 16.3 - In Exercises 16.60-16.63, refer to the discussion...Ch. 16.3 - Starting Salaries. The National Association of...Ch. 16.3 - Working with Large Data Sets In Exercises...Ch. 16.3 - Working with Large Data Sets In Exercises...Ch. 16.3 - In Exercises 16.64-16.72, use the technology of...Ch. 16.3 - In Exercises 16.6416.72, use the technology of...Ch. 16.3 - In Exercises 16.64-16.72, use the technology of...Ch. 16.3 - In Exercises 16.64-16.72, use the technology of...Ch. 16.3 - Prob. 70ECh. 16.3 - Prob. 71ECh. 16.3 - Prob. 72ECh. 16.3 - Prob. 73ECh. 16.3 - Prob. 74ECh. 16.3 - Prob. 75ECh. 16.4 - What is the purpose of doing a multiple...Ch. 16.4 - Fill in the blank: If a confidence interval for...Ch. 16.4 - Explain the difference between the family...Ch. 16.4 - Regarding family and individual confidence levels,...Ch. 16.4 - What is the name of the distribution on which the...Ch. 16.4 - The parameter v for the q-curve in a Tukey...Ch. 16.4 - Explain the essential difference between obtaining...Ch. 16.4 - Determine the following for a q-curve with...Ch. 16.4 - Determine the following for a q-curve with...Ch. 16.4 - Find the following for a q-curve with parameters K...Ch. 16.4 - Find the following for a q-curve with parameters K...Ch. 16.4 - Suppose that you conduct a one-way ANOVA test and...Ch. 16.4 - In Exercises 16.88-16.93, we repeal the data from...Ch. 16.4 - In Exercises 16.88-16.93, we repeat the data from...Ch. 16.4 - In Exercises 16.88-16.93, we repeat the data from...Ch. 16.4 - In Exercises 16.88-16.93, we repeat the data from...Ch. 16.4 - In Exercises 16.88-16.93, we repeat the data from...Ch. 16.4 - Prob. 93ECh. 16.4 - Prob. 94ECh. 16.4 - In Exercises 16.94-16.99, use Procedure 16.2 on...Ch. 16.4 - In Exercises 16.94-16.99, use Procedure 16.2 on...Ch. 16.4 - In Exercises 16.94-16.99, use Procedure 16.2 on...Ch. 16.4 - Prob. 98ECh. 16.4 - Prob. 99ECh. 16.4 - Prob. 100ECh. 16.4 - Prob. 101ECh. 16.4 - In Exercises 16.100-16.105, use the technology of...Ch. 16.4 - Prob. 103ECh. 16.4 - Prob. 104ECh. 16.4 - Prob. 105ECh. 16.4 - In Exercises 16.106-16.109, use Procedure 10.2 on...Ch. 16.4 - Prob. 107ECh. 16.4 - Prob. 108ECh. 16.4 - Prob. 109ECh. 16.4 - Prob. 110ECh. 16.4 - In Exercises 16.110-16.118, we repeat information...Ch. 16.4 - Prob. 112ECh. 16.4 - Prob. 113ECh. 16.4 - Prob. 114ECh. 16.4 - In Exercises 16.110-16.118, we repeat information...Ch. 16.4 - Prob. 116ECh. 16.4 - Prob. 117ECh. 16.4 - In Exercises 16.110-16.16.118, we repeat...Ch. 16.4 - Explain why the family confidence level, not the...Ch. 16.4 - Prob. 120ECh. 16.4 - Energy Consumption. Apply Table 16.11 on page 723...Ch. 16.5 - Prob. 122ECh. 16.5 - Prob. 123ECh. 16.5 - Prob. 124ECh. 16.5 - Prob. 125ECh. 16.5 - Prob. 126ECh. 16.5 - The measure of total variation of all the ranks is...Ch. 16.5 - Regarding a Kruskal-Wallis test, fill in the...Ch. 16.5 - Prob. 129ECh. 16.5 - Prob. 130ECh. 16.5 - In each of Exercises 16.130-16.133, suppose that...Ch. 16.5 - Prob. 132ECh. 16.5 - Prob. 133ECh. 16.5 - Prob. 134ECh. 16.5 - Prob. 135ECh. 16.5 - Prob. 136ECh. 16.5 - Prob. 137ECh. 16.5 - Prob. 138ECh. 16.5 - Prob. 139ECh. 16.5 - Prob. 140ECh. 16.5 - Prob. 141ECh. 16.5 - Prob. 142ECh. 16.5 - Prob. 143ECh. 16.5 - Prob. 144ECh. 16.5 - In Exercises 16.144-16.149, perform a...Ch. 16.5 - In Exercises 16.144-16.149, perform a...Ch. 16.5 - In Exercises 16.144-16.149, perform a...Ch. 16.5 - Prob. 148ECh. 16.5 - Prob. 149ECh. 16.5 - Prob. 150ECh. 16.5 - Prob. 151ECh. 16.5 - Prob. 152ECh. 16.5 - Prob. 153ECh. 16.5 - Prob. 154ECh. 16.5 - Prob. 155ECh. 16.5 - Prob. 156ECh. 16.5 - Prob. 157ECh. 16.5 - Prob. 158ECh. 16.5 - Prob. 159ECh. 16.5 - Prob. 160ECh. 16.5 - Prob. 161ECh. 16.5 - Prob. 162ECh. 16.5 - Prob. 163ECh. 16.5 - Prob. 164ECh. 16.5 - Prob. 165ECh. 16.5 - Prob. 166ECh. 16.5 - Prob. 167ECh. 16 - For what is one-way ANOVA used?Ch. 16 - State the four assumptions for one-way ANOVA, and...Ch. 16 - On what distribution does one-way ANOVA rely?Ch. 16 - Suppose that you want to compare the means of...Ch. 16 - Prob. 5RPCh. 16 - In one-way ANOVA, a. list and interpret the three...Ch. 16 - Prob. 7RPCh. 16 - Prob. 8RPCh. 16 - Prob. 9RPCh. 16 - Prob. 10RPCh. 16 - Prob. 11RPCh. 16 - Suppose that you want to compare the means of...Ch. 16 - Prob. 13RPCh. 16 - Prob. 14RPCh. 16 - Prob. 15RPCh. 16 - Prob. 16RPCh. 16 - In Problems 17-21, consider an F-curve with df =...Ch. 16 - Prob. 18RPCh. 16 - Prob. 19RPCh. 16 - Prob. 20RPCh. 16 - Prob. 21RPCh. 16 - Consider a q -curve with parameters 3 and 14. a....Ch. 16 - Consider the following hypothetical samples. A B C...Ch. 16 - Losses to Robbery. The Federal Bureau of...Ch. 16 - Prob. 25RPCh. 16 - Prob. 26RPCh. 16 - Prob. 27RPCh. 16 - Losses to Robbery. Refer to Problem 24. a. At the...Ch. 16 - Foot-pressure Angle. Genu valgum, commonly known...Ch. 16 - Prob. 30RPCh. 16 - Prob. 31RPCh. 16 - Prob. 32RPCh. 16 - In Problems 3234, use the technology of your...Ch. 16 - Prob. 34RPCh. 16 - Prob. 35RPCh. 16 - In Problems 3537, refer to the specified problem...Ch. 16 - Prob. 37RPCh. 16 - Recall from Chapter 1 (see page 34) that the Focus...Ch. 16 - SELF-PERCEPTION AND PHYSICAL ACTIVITY As you...
Knowledge Booster


Learn more about
Need a deep-dive on the concept behind this application? Look no further. Learn more about this topic, statistics and related others by exploring similar questions and additional content below.Similar questions
- You find out that the dietary scale you use each day is off by a factor of 2 ounces (over — at least that’s what you say!). The margin of error for your scale was plus or minus 0.5 ounces before you found this out. What’s the margin of error now?arrow_forwardSuppose that Sue and Bill each make a confidence interval out of the same data set, but Sue wants a confidence level of 80 percent compared to Bill’s 90 percent. How do their margins of error compare?arrow_forwardSuppose that you conduct a study twice, and the second time you use four times as many people as you did the first time. How does the change affect your margin of error? (Assume the other components remain constant.)arrow_forward
- Out of a sample of 200 babysitters, 70 percent are girls, and 30 percent are guys. What’s the margin of error for the percentage of female babysitters? Assume 95 percent confidence.What’s the margin of error for the percentage of male babysitters? Assume 95 percent confidence.arrow_forwardYou sample 100 fish in Pond A at the fish hatchery and find that they average 5.5 inches with a standard deviation of 1 inch. Your sample of 100 fish from Pond B has the same mean, but the standard deviation is 2 inches. How do the margins of error compare? (Assume the confidence levels are the same.)arrow_forwardA survey of 1,000 dental patients produces 450 people who floss their teeth adequately. What’s the margin of error for this result? Assume 90 percent confidence.arrow_forward
- The annual aggregate claim amount of an insurer follows a compound Poisson distribution with parameter 1,000. Individual claim amounts follow a Gamma distribution with shape parameter a = 750 and rate parameter λ = 0.25. 1. Generate 20,000 simulated aggregate claim values for the insurer, using a random number generator seed of 955.Display the first five simulated claim values in your answer script using the R function head(). 2. Plot the empirical density function of the simulated aggregate claim values from Question 1, setting the x-axis range from 2,600,000 to 3,300,000 and the y-axis range from 0 to 0.0000045. 3. Suggest a suitable distribution, including its parameters, that approximates the simulated aggregate claim values from Question 1. 4. Generate 20,000 values from your suggested distribution in Question 3 using a random number generator seed of 955. Use the R function head() to display the first five generated values in your answer script. 5. Plot the empirical density…arrow_forwardFind binomial probability if: x = 8, n = 10, p = 0.7 x= 3, n=5, p = 0.3 x = 4, n=7, p = 0.6 Quality Control: A factory produces light bulbs with a 2% defect rate. If a random sample of 20 bulbs is tested, what is the probability that exactly 2 bulbs are defective? (hint: p=2% or 0.02; x =2, n=20; use the same logic for the following problems) Marketing Campaign: A marketing company sends out 1,000 promotional emails. The probability of any email being opened is 0.15. What is the probability that exactly 150 emails will be opened? (hint: total emails or n=1000, x =150) Customer Satisfaction: A survey shows that 70% of customers are satisfied with a new product. Out of 10 randomly selected customers, what is the probability that at least 8 are satisfied? (hint: One of the keyword in this question is “at least 8”, it is not “exactly 8”, the correct formula for this should be = 1- (binom.dist(7, 10, 0.7, TRUE)). The part in the princess will give you the probability of seven and less than…arrow_forwardplease answer these questionsarrow_forward
- Selon une économiste d’une société financière, les dépenses moyennes pour « meubles et appareils de maison » ont été moins importantes pour les ménages de la région de Montréal, que celles de la région de Québec. Un échantillon aléatoire de 14 ménages pour la région de Montréal et de 16 ménages pour la région Québec est tiré et donne les données suivantes, en ce qui a trait aux dépenses pour ce secteur d’activité économique. On suppose que les données de chaque population sont distribuées selon une loi normale. Nous sommes intéressé à connaitre si les variances des populations sont égales.a) Faites le test d’hypothèse sur deux variances approprié au seuil de signification de 1 %. Inclure les informations suivantes : i. Hypothèse / Identification des populationsii. Valeur(s) critique(s) de Fiii. Règle de décisioniv. Valeur du rapport Fv. Décision et conclusion b) A partir des résultats obtenus en a), est-ce que l’hypothèse d’égalité des variances pour cette…arrow_forwardAccording to an economist from a financial company, the average expenditures on "furniture and household appliances" have been lower for households in the Montreal area than those in the Quebec region. A random sample of 14 households from the Montreal region and 16 households from the Quebec region was taken, providing the following data regarding expenditures in this economic sector. It is assumed that the data from each population are distributed normally. We are interested in knowing if the variances of the populations are equal. a) Perform the appropriate hypothesis test on two variances at a significance level of 1%. Include the following information: i. Hypothesis / Identification of populations ii. Critical F-value(s) iii. Decision rule iv. F-ratio value v. Decision and conclusion b) Based on the results obtained in a), is the hypothesis of equal variances for this socio-economic characteristic measured in these two populations upheld? c) Based on the results obtained in a),…arrow_forwardA major company in the Montreal area, offering a range of engineering services from project preparation to construction execution, and industrial project management, wants to ensure that the individuals who are responsible for project cost estimation and bid preparation demonstrate a certain uniformity in their estimates. The head of civil engineering and municipal services decided to structure an experimental plan to detect if there could be significant differences in project evaluation. Seven projects were selected, each of which had to be evaluated by each of the two estimators, with the order of the projects submitted being random. The obtained estimates are presented in the table below. a) Complete the table above by calculating: i. The differences (A-B) ii. The sum of the differences iii. The mean of the differences iv. The standard deviation of the differences b) What is the value of the t-statistic? c) What is the critical t-value for this test at a significance level of 1%?…arrow_forward
arrow_back_ios
SEE MORE QUESTIONS
arrow_forward_ios
Recommended textbooks for you
 Glencoe Algebra 1, Student Edition, 9780079039897...AlgebraISBN:9780079039897Author:CarterPublisher:McGraw Hill
 Holt Mcdougal Larson Pre-algebra: Student Edition...AlgebraISBN:9780547587776Author:HOLT MCDOUGALPublisher:HOLT MCDOUGAL
 Big Ideas Math A Bridge To Success Algebra 1: Stu...AlgebraISBN:9781680331141Author:HOUGHTON MIFFLIN HARCOURTPublisher:Houghton Mifflin Harcourt
Glencoe Algebra 1, Student Edition, 9780079039897...
Algebra
ISBN:9780079039897
Author:Carter
Publisher:McGraw Hill
Holt Mcdougal Larson Pre-algebra: Student Edition...
Algebra
ISBN:9780547587776
Author:HOLT MCDOUGAL
Publisher:HOLT MCDOUGAL
Big Ideas Math A Bridge To Success Algebra 1: Stu...
Algebra
ISBN:9781680331141
Author:HOUGHTON MIFFLIN HARCOURT
Publisher:Houghton Mifflin Harcourt
Hypothesis Testing using Confidence Interval Approach; Author: BUM2413 Applied Statistics UMP;https://www.youtube.com/watch?v=Hq1l3e9pLyY;License: Standard YouTube License, CC-BY
Hypothesis Testing - Difference of Two Means - Student's -Distribution & Normal Distribution; Author: The Organic Chemistry Tutor;https://www.youtube.com/watch?v=UcZwyzwWU7o;License: Standard Youtube License