Mathematics for Elementary Teachers with Activities Plus MyLab Math -- Title-Specific Access Card Package (5th Edition)
5th Edition
ISBN: 9780134754208
Author: Beckmann, Sybilla
Publisher: PEARSON
expand_more
expand_more
format_list_bulleted
Concept explainers
Videos
Textbook Question
Chapter 15.4, Problem 15P
Compute the mean and the MAD for each of the dot plots in Figure 15.41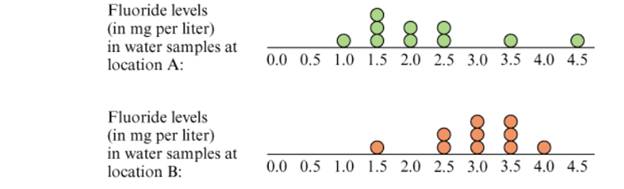
Figure 15.41 Dot plots of fluoride levels in water attwo locations.
b. Use the means and MADs from part (a) to discuss how the fluoride levels at the two locations compare. What do the means tell us? What do the MADs tell us? How confident can we be in distinguishing the levels of fluoride in the water at the two locations?
Expert Solution & Answer
Want to see the full answer?
Check out a sample textbook solution
Students have asked these similar questions
No chatgpt pls will upvote
1. Find the mean of the x-values (x-bar)
and the mean of the y-values (y-bar) and write/label each here:
2. Label the second row in the table using proper notation; then, complete the table. In the fifth and sixth
columns, show the 'products' of what you're multiplying, as well as the answers.
X
y
x minus x-bar y minus y-bar (x minus x-bar)(y minus y-bar)
(x minus x-bar)^2
xy
16
20
34
4-2
5 2
3. Write the sums that represents Sxx and Sxy in the table, at the bottom of their respective columns.
4. Find the slope of the Regression line: bi
=
(simplify your answer)
5. Find the y-intercept of the Regression line, and then write the equation of the Regression line.
Show your work. Then, BOX your final answer. Express your line as "y-hat equals...
Apply STATA commands & submit the output for each question only when
indicated below
i.
Generate the log of birthweight and family income of children. Name
these new variables Ibwght & Ifaminc. Include the output of this
code.
ii. Apply the command sum with the detail option to the variable
faminc. Note: you should find the 25th percentile value, the 50th
percentile and the 75th percentile value of faminc from the output -
you will need it to answer the next question Include the output of this
code.
iii.
iv.
Use the output from part ii of this question to Generate a variable
called "high_faminc" that takes a value 1 if faminc is less than or
equal to the 25th percentile, it takes the value 2 if faminc is greater
than 25th percentile but less than or equal to the 50th percentile, it
takes the value 3 if faminc is greater than 50th percentile but less than
or equal to the 75th percentile, it takes the value 4 if faminc is greater
than the 75th percentile. Include the outcome of this code…
Chapter 15 Solutions
Mathematics for Elementary Teachers with Activities Plus MyLab Math -- Title-Specific Access Card Package (5th Edition)
Ch. 15.1 - Give two examples of a statistical question and...Ch. 15.1 - A class has a collection of 100 bottle caps and...Ch. 15.1 - Neil, a third-grader, asked 10 of his classmates...Ch. 15.1 - An announcer of a TV program invited viewers to...Ch. 15.1 - There is a bowl containing 300 plastic tiles. Some...Ch. 15.1 - There is a bowl containing 80 green tiles and an...Ch. 15.1 - At a factory that produces doorknobs, 1500...Ch. 15.1 - At a factory that produces switches, 3000 switches...Ch. 15.1 - At a light bulb factory, 1728 light bulbs are...Ch. 15.1 - Carter has a large collection of marbles. He knows...
Ch. 15.1 - The following problem is an example of the...Ch. 15.1 - A group studying violence wants to determine the...Ch. 15.2 - Three third-grade classes are having a contest to...Ch. 15.2 - Find 3 coins of any type (as long as all 3 have a...Ch. 15.2 - Table 15.3 shows women’s 400-meter freestyle...Ch. 15.2 - Using an Internet browser, go to census.gov, the...Ch. 15.2 - Using an Internet browser, go to the webpage of...Ch. 15.2 - Using an Internet browser, go to one of the...Ch. 15.2 - Using an Internet browser, go to one of the...Ch. 15.2 - a. Describe in detail an activity suitable for use...Ch. 15.3 - In your own words, explain why the following two...Ch. 15.3 - Explain why the mean of a list of numbers must...Ch. 15.3 - Explain why the mean of two numbers is exactly...Ch. 15.3 - Shante caught 17 ladybugs every day for 4 days....Ch. 15.3 - John’s average annual income over a 4-year period...Ch. 15.3 - Tracy’s times swimming 200 yards were as follows:...Ch. 15.3 - Explain how you can quickly calculate the mean of...Ch. 15.3 - Explain how you can quickly calculate the mean of...Ch. 15.3 - average on her first 3 math tests was 80. Her...Ch. 15.3 - A teacher gives a 10-point test to a class of 10...Ch. 15.3 - In your own words, describe how to view the mean...Ch. 15.3 - Discuss Jessica’s reasoning about calculating the...Ch. 15.3 - ]The dot plot in Figure 15.21 represents the...Ch. 15.3 - For each of the following situations, decide...Ch. 15.3 - A teacher gives a 10-point test to a class of 9...Ch. 15.3 - A teacher gives a 10-point test to a class of 9...Ch. 15.3 - In Ritzy County, the average annual household...Ch. 15.3 - In county A, the average score on the grade 5 Iowa...Ch. 15.3 - a. The histogram at the top of Figure 15.22 shows...Ch. 15.3 - * Ms. Smith needs to figure her students’ homework...Ch. 15.3 - The average speed of a moving object during a...Ch. 15.4 - What is the difference between scoring in the 90th...Ch. 15.4 - What is the purpose of reporting a student’s...Ch. 15.4 - The three histograms in Figure 15.37 show the...Ch. 15.4 - At a math center in a class, there is a bag filled...Ch. 15.4 - Refer to Figure 15.26 on page 706. a. Refer to the...Ch. 15.4 - Refer to Figure 15.26 on page 706. a. Refer to the...Ch. 15.4 - Refer to Figure 15.26 on page 706. a. Write at...Ch. 15.4 - Use the NAEP long-term trend data about...Ch. 15.4 - Determine the median and interquartile range for...Ch. 15.4 - a. Make a box plot for the data in Figure 15.38....Ch. 15.4 - Determine the medians and interquartile ranges for...Ch. 15.4 - a. Make box plots for the dot plots in Figure...Ch. 15.4 - A fifth-grade class is wondering ¡f girls’ names...Ch. 15.4 - Compute the mean and the MAD for each of the dot...Ch. 15.4 - On a state-wide test graded on a 10-point scale,...Ch. 15.4 - A 400-point test is given to a group of students....
Knowledge Booster


Learn more about
Need a deep-dive on the concept behind this application? Look no further. Learn more about this topic, subject and related others by exploring similar questions and additional content below.Similar questions
- solve this on paperarrow_forwardFor each given function f(x) find f'(x) using the rules learned in section 9.5. 1. f(x)=x32 32x 2. f(x)=7x+13 3. f(x) = x4 4. f(x) = √√x³ 5. f(x) = 3x²+ 3 x2arrow_forwardApply STATA commands & submit the output for each question only when indicated below i. Apply the command egen to create a variable called "wyd" which is the rowtotal function on variables bwght & faminc. ii. Apply the list command for the first 10 observations to show that the code in part i worked. Include the outcome of this code iii. Apply the egen command to create a new variable called "bwghtsum" using the sum function on variable bwght by the variable high_faminc (Note: need to apply the bysort' statement) iv. Apply the "by high_faminc" statement to find the V. descriptive statistics of bwght and bwghtsum Include the output of this code. Why is there a difference between the standard deviations of bwght and bwghtsum from part iv of this question?arrow_forward
- According to a health information website, the distribution of adults’ diastolic blood pressure (in millimeters of mercury, mmHg) can be modeled by a normal distribution with mean 70 mmHg and standard deviation 20 mmHg. b. Above what diastolic pressure would classify someone in the highest 1% of blood pressures? Show all calculations used.arrow_forwardWrite STATA codes which will generate the outcomes in the questions & submit the output for each question only when indicated below i. ii. iii. iv. V. Write a code which will allow STATA to go to your favorite folder to access your files. Load the birthweight1.dta dataset from your favorite folder and save it under a different filename to protect data integrity. Call the new dataset babywt.dta (make sure to use the replace option). Verify that it contains 2,998 observations and 8 variables. Include the output of this code. Are there missing observations for variable(s) for the variables called bwght, faminc, cigs? How would you know? (You may use more than one code to show your answer(s)) Include the output of your code (s). Write the definitions of these variables: bwght, faminc, male, white, motheduc,cigs; which of these variables are categorical? [Hint: use the labels of the variables & the browse command] Who is this dataset about? Who can use this dataset to answer what kind of…arrow_forwardApply STATA commands & submit the output for each question only when indicated below İ. ii. iii. iv. V. Apply the command summarize on variables bwght and faminc. What is the average birthweight of babies and family income of the respondents? Include the output of this code. Apply the tab command on the variable called male. How many of the babies and what share of babies are male? Include the output of this code. Find the summary statistics (i.e. use the sum command) of the variables bwght and faminc if the babies are white. Include the output of this code. Find the summary statistics (i.e. use the sum command) of the variables bwght and faminc if the babies are male but not white. Include the output of this code. Using your answers to previous subparts of this question: What is the difference between the average birthweight of a baby who is male and a baby who is male but not white? What can you say anything about the difference in family income of the babies that are male and male…arrow_forward
- not use ai pleasearrow_forwardPidgeonhole Principle 1. The floor of x, written [x], also called the integral part, integer part, or greatest integer, is defined as the greatest integer less than or equal to x. Similarly the ceiling of x, written [x], is the smallest integer greater than or equal to x. Try figuring out the answers to the following: (a) [2.1] (b) [2] (c) [2.9] (d) [2.1] (e) [2] (f) [2.9] 2. The simple pidgeonhole principle states that, if you have N places and k items (k> N), then at least one hole must have more than one item in it. We tried this with chairs and students: Assume you have N = 12 chairs and k = 18 students. Then at least one chair must have more than one student on it. 3. The general pidgeonhole principle states that, if you have N places and k items, then at least one hole must have [] items or more in it. Try this out with (a) n = 10 chairs and k = 15 students (b) n = 10 chairs and k = 23 students (c) n = 10 chairs and k = 20 students 4. There are 34 problems on these pages, and we…arrow_forwardDetermine if the set of vectors is linearly independent or linearly dependent. linearly independent O linearly dependent Save Answer Q2.2 1 Point Determine if the set of vectors spans R³. they span R³ they do not span R³ Save Answer 23 Q2.3 1 Point Determine if the set of vectors is linearly independent or linearly dependent. linearly independent O linearly dependent Save Answer 1111 1110 Q2.4 1 Point Determine if the set of vectors spans R4. O they span R4 they do not span IR4 1000; 111O'arrow_forward
- The everything combined problem Suppose that a computer science laboratory has 15 workstations and 10 servers. A cable can be used to directly connect a workstation to a server. For each server, only one direct connection to that server can be active at any time. 1. How many cables would you need to connect each station to each server? 2. How many stations can be used at one time? 3. How many stations can not be used at any one time? 4. How many ways are there to pick 10 stations out of 15? 5. (This one is tricky) We want to guarantee that at any time any set of 10 or fewer workstations can simultaneously access different servers via direct connections. What is the minimum number of direct connections needed to achieve this goal?arrow_forwardCan you help me with D and Earrow_forwardQ1.1 1 Point Any set {V1, V2, V3, V4} that consists of four different vectors from R cannot possibly span Rº. True False Save Answerarrow_forward
arrow_back_ios
SEE MORE QUESTIONS
arrow_forward_ios
Recommended textbooks for you
 Mathematics For Machine TechnologyAdvanced MathISBN:9781337798310Author:Peterson, John.Publisher:Cengage Learning,
 Algebra & Trigonometry with Analytic GeometryAlgebraISBN:9781133382119Author:SwokowskiPublisher:Cengage
 Functions and Change: A Modeling Approach to Coll...AlgebraISBN:9781337111348Author:Bruce Crauder, Benny Evans, Alan NoellPublisher:Cengage Learning
 College Algebra (MindTap Course List)AlgebraISBN:9781305652231Author:R. David Gustafson, Jeff HughesPublisher:Cengage Learning
 Glencoe Algebra 1, Student Edition, 9780079039897...AlgebraISBN:9780079039897Author:CarterPublisher:McGraw Hill
Mathematics For Machine Technology
Advanced Math
ISBN:9781337798310
Author:Peterson, John.
Publisher:Cengage Learning,
Algebra & Trigonometry with Analytic Geometry
Algebra
ISBN:9781133382119
Author:Swokowski
Publisher:Cengage
Functions and Change: A Modeling Approach to Coll...
Algebra
ISBN:9781337111348
Author:Bruce Crauder, Benny Evans, Alan Noell
Publisher:Cengage Learning
College Algebra (MindTap Course List)
Algebra
ISBN:9781305652231
Author:R. David Gustafson, Jeff Hughes
Publisher:Cengage Learning
Glencoe Algebra 1, Student Edition, 9780079039897...
Algebra
ISBN:9780079039897
Author:Carter
Publisher:McGraw Hill
Mod-01 Lec-01 Discrete probability distributions (Part 1); Author: nptelhrd;https://www.youtube.com/watch?v=6x1pL9Yov1k;License: Standard YouTube License, CC-BY
Discrete Probability Distributions; Author: Learn Something;https://www.youtube.com/watch?v=m9U4UelWLFs;License: Standard YouTube License, CC-BY
Probability Distribution Functions (PMF, PDF, CDF); Author: zedstatistics;https://www.youtube.com/watch?v=YXLVjCKVP7U;License: Standard YouTube License, CC-BY
Discrete Distributions: Binomial, Poisson and Hypergeometric | Statistics for Data Science; Author: Dr. Bharatendra Rai;https://www.youtube.com/watch?v=lHhyy4JMigg;License: Standard Youtube License