
Videos
- (a) In Problem 12 of Exercises 12.6 you solved a potential problem using a special form of Poisson’s equation
- (b) Use the result in part (a) to approximate the solution of the Poisson equation
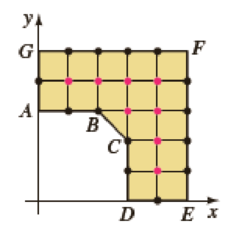
FIGURE 15.1.7 Región for Problem 7
Want to see the full answer?
Check out a sample textbook solution
Chapter 15 Solutions
Differential Equations with Boundary-Value Problems


- For each given function f(x) find f'(x) using the rules learned in section 9.5. 1. f(x)=x32 32x 2. f(x)=7x+13 3. f(x) = x4 4. f(x) = √√x³ 5. f(x) = 3x²+ 3 x2arrow_forwardApply STATA commands & submit the output for each question only when indicated below i. Apply the command egen to create a variable called "wyd" which is the rowtotal function on variables bwght & faminc. ii. Apply the list command for the first 10 observations to show that the code in part i worked. Include the outcome of this code iii. Apply the egen command to create a new variable called "bwghtsum" using the sum function on variable bwght by the variable high_faminc (Note: need to apply the bysort' statement) iv. Apply the "by high_faminc" statement to find the V. descriptive statistics of bwght and bwghtsum Include the output of this code. Why is there a difference between the standard deviations of bwght and bwghtsum from part iv of this question?arrow_forwardAccording to a health information website, the distribution of adults’ diastolic blood pressure (in millimeters of mercury, mmHg) can be modeled by a normal distribution with mean 70 mmHg and standard deviation 20 mmHg. b. Above what diastolic pressure would classify someone in the highest 1% of blood pressures? Show all calculations used.arrow_forward
- Write STATA codes which will generate the outcomes in the questions & submit the output for each question only when indicated below i. ii. iii. iv. V. Write a code which will allow STATA to go to your favorite folder to access your files. Load the birthweight1.dta dataset from your favorite folder and save it under a different filename to protect data integrity. Call the new dataset babywt.dta (make sure to use the replace option). Verify that it contains 2,998 observations and 8 variables. Include the output of this code. Are there missing observations for variable(s) for the variables called bwght, faminc, cigs? How would you know? (You may use more than one code to show your answer(s)) Include the output of your code (s). Write the definitions of these variables: bwght, faminc, male, white, motheduc,cigs; which of these variables are categorical? [Hint: use the labels of the variables & the browse command] Who is this dataset about? Who can use this dataset to answer what kind of…arrow_forwardApply STATA commands & submit the output for each question only when indicated below İ. ii. iii. iv. V. Apply the command summarize on variables bwght and faminc. What is the average birthweight of babies and family income of the respondents? Include the output of this code. Apply the tab command on the variable called male. How many of the babies and what share of babies are male? Include the output of this code. Find the summary statistics (i.e. use the sum command) of the variables bwght and faminc if the babies are white. Include the output of this code. Find the summary statistics (i.e. use the sum command) of the variables bwght and faminc if the babies are male but not white. Include the output of this code. Using your answers to previous subparts of this question: What is the difference between the average birthweight of a baby who is male and a baby who is male but not white? What can you say anything about the difference in family income of the babies that are male and male…arrow_forwardnot use ai pleasearrow_forward
- Pidgeonhole Principle 1. The floor of x, written [x], also called the integral part, integer part, or greatest integer, is defined as the greatest integer less than or equal to x. Similarly the ceiling of x, written [x], is the smallest integer greater than or equal to x. Try figuring out the answers to the following: (a) [2.1] (b) [2] (c) [2.9] (d) [2.1] (e) [2] (f) [2.9] 2. The simple pidgeonhole principle states that, if you have N places and k items (k> N), then at least one hole must have more than one item in it. We tried this with chairs and students: Assume you have N = 12 chairs and k = 18 students. Then at least one chair must have more than one student on it. 3. The general pidgeonhole principle states that, if you have N places and k items, then at least one hole must have [] items or more in it. Try this out with (a) n = 10 chairs and k = 15 students (b) n = 10 chairs and k = 23 students (c) n = 10 chairs and k = 20 students 4. There are 34 problems on these pages, and we…arrow_forwardDetermine if the set of vectors is linearly independent or linearly dependent. linearly independent O linearly dependent Save Answer Q2.2 1 Point Determine if the set of vectors spans R³. they span R³ they do not span R³ Save Answer 23 Q2.3 1 Point Determine if the set of vectors is linearly independent or linearly dependent. linearly independent O linearly dependent Save Answer 1111 1110 Q2.4 1 Point Determine if the set of vectors spans R4. O they span R4 they do not span IR4 1000; 111O'arrow_forwardThe everything combined problem Suppose that a computer science laboratory has 15 workstations and 10 servers. A cable can be used to directly connect a workstation to a server. For each server, only one direct connection to that server can be active at any time. 1. How many cables would you need to connect each station to each server? 2. How many stations can be used at one time? 3. How many stations can not be used at any one time? 4. How many ways are there to pick 10 stations out of 15? 5. (This one is tricky) We want to guarantee that at any time any set of 10 or fewer workstations can simultaneously access different servers via direct connections. What is the minimum number of direct connections needed to achieve this goal?arrow_forward
- Can you help me with D and Earrow_forwardQ1.1 1 Point Any set {V1, V2, V3, V4} that consists of four different vectors from R cannot possibly span Rº. True False Save Answerarrow_forwardFind: lim x →-6 f (x) limx-4 f (x) lim x-1 f (x) lim x →4 f (x) (-6,3) • (-1,5) -8 -7 (-6,-2) 4+ (4,5) (4,2) • (-1,1) -6arrow_forward
 Linear Algebra: A Modern IntroductionAlgebraISBN:9781285463247Author:David PoolePublisher:Cengage Learning
 Algebra & Trigonometry with Analytic GeometryAlgebraISBN:9781133382119Author:SwokowskiPublisher:Cengage