
Concept explainers
Videos
Meteorology The table shows the maximum daily high temperatures (in degrees Fahrenheit) in
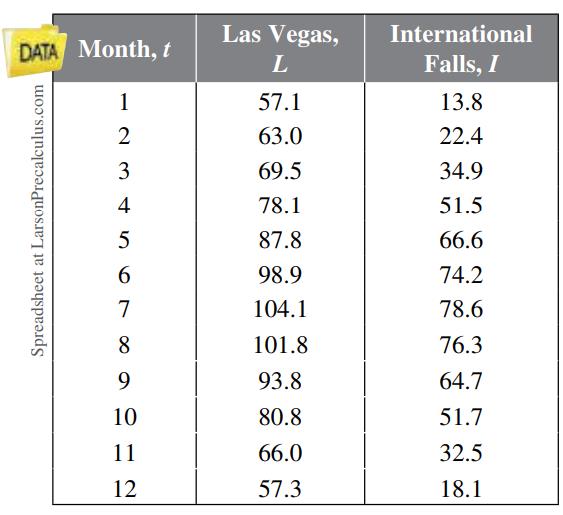
(a) A model for the temperatures in
Find a trigonometric model for the temperatures in International Falls.
(b) Use a graphing utility to graph the data points and the model for the temperatures in
(c) Use the graphing utility to graph the data points and the model for the temperatures in International Falls. How well does the model fit the data?
(d) Use the models to estimate the average maximum temperature in each city. Which value in each model did you use? Explain.
(e) What is the period of each model? Are the periods what you expected? Explain.
(f) Which city has the greater variability in temperature throughout the year? Which value in each model determines this variability? Explain.

Trending nowThis is a popular solution!

Chapter 1 Solutions
Bundle: Trigonometry, 10th + Webassign Printed Access Card For Larson's Trigonometry, 10th Edition, Single-term


- T2.3: Prove that there exists a connected graph with degrees d₁ ≥ d₂ >> dn if and only if d1, d2,..., dn is graphic, d ≥ 1 and di≥2n2. That is, some graph having degree sequence with these conditions is connected. Hint - Do not attempt to directly prove this using Erdos-Gallai conditions. Instead work with a realization and show that 2-switches can be used to make a connected graph with the same degree sequence. Facts that can be useful: a component (i.e., connected) with n₁ vertices and at least n₁ edges has a cycle. Note also that a 2-switch using edges from different components of a forest will not necessarily reduce the number of components. Make sure that you justify that your proof has a 2-switch that does decrease the number of components.arrow_forwardT2.2 Prove that a sequence s d₁, d₂,..., dn with n ≥ 3 of integers with 1≤d; ≤ n − 1 is the degree sequence of a connected unicyclic graph (i.e., with exactly one cycle) of order n if and only if at most n-3 terms of s are 1 and Σ di = 2n. (i) Prove it by induction along the lines of the inductive proof for trees. There will be a special case to handle when no d₂ = 1. (ii) Prove it by making use of the caterpillar construction. You may use the fact that adding an edge between 2 non-adjacent vertices of a tree creates a unicylic graph.arrow_forward= == T2.1: Prove that the necessary conditions for a degree sequence of a tree are sufficient by showing that if di 2n-2 there is a caterpillar with these degrees. Start the construction as follows: if d1, d2,...,d2 and d++1 = d = 1 construct a path v1, v2, ..., vt and add d; - 2 pendent edges to v, for j = 2,3,..., t₁, d₁ - 1 to v₁ and d₁ - 1 to v₁. Show that this construction results vj in a caterpillar with degrees d1, d2, ..., dnarrow_forward
- 4 sin 15° cos 15° √2 cos 405°arrow_forward2 18-17-16-15-14-13-12-11-10 -9 -8 -6 -5 -4-3-2-1 $ 6 8 9 10 -2+ The curve above is the graph of a sinusoidal function. It goes through the points (-10, -1) and (4, -1). Find a sinusoidal function that matches the given graph. If needed, you can enter π-3.1416... as 'pi' in your answer, otherwise use at least 3 decimal digits. f(x) = > Next Questionarrow_forwardketch a graph of the function f(x) = 3 cos (표) 6. x +1 5 4 3 3 80 9 2+ 1 -9 -8 -7 -6 -5 -4 -3 -2 -1 1 2 3 4 5 6 7 -1 -2 -3+ -4 5 -6+ Clear All Draw: пи > Next Questionarrow_forward
- Draw the following graph on the interval πT 5π < x < 2 2 y = 2 sin (2(x+7)) 6. 5. 4 3 3 2 1 +3 /2 -π/3 -π/6 π/6 π/3 π/2 2π/3 5π/6 π 7π/6 4π/3 3π/2 5π/311π/6 2π 13π/67π/3 5π Clear All Draw:arrow_forwardketch a graph of the function f(x) = 3 cos (표) 6. x +1 5 4 3 3 80 9 2+ 1 -9 -8 -7 -6 -5 -4 -3 -2 -1 1 2 3 4 5 6 7 -1 -2 -3+ -4 5 -6+ Clear All Draw: пи > Next Questionarrow_forward3 2 20-10-18-17-16-15-14-13-12-11-10-9 -8 -7 -6 -$4-3-2-1 -1 -2 -3 4- -5+ The curve above is the graph of a sinusoidal function. It goes through the points (-8, -4) and (6,-4). Find a sinusoidal function that matches the given graph. If needed, you can enter π=3.1416... as 'pi' in your answer, otherwise use at least 3 decimal digits. f(x) = > Next Question Barrow_forward
- X Grades for X Assignmen X A-Z Datab XE Biocultural X EBSCO-Ful X Review es/119676/assignments/3681238 Review Quiz 8.1-p2 points possible Answered: 3/5 ● Question 1 4+ 3. 2 1 13 /12-11 -10 -9 -8 -7 -6 -5 -4 -3 -2 -1 1 2 3 4 -1 -2 -3 -4- 5 2 6 The curve above is the graph of a sinusoidal function. It goes through the points (-7,0) and (3,0). Find a sinusoidal function that matches the given graph. If needed, you can enter π=3.1416... as 'pi' in your answer, otherwise use at least 3 decimal digits. f(x) = > Next Question 申 J % F 刀 Q Search S € t ח Y 7 I * 00 J ப I Darrow_forward2 d) Draw the following graph on the interval k 5π Next Questionarrow_forwardDraw the following graph on the interval 5л Next Questionarrow_forward
 Algebra & Trigonometry with Analytic GeometryAlgebraISBN:9781133382119Author:SwokowskiPublisher:Cengage
 Trigonometry (MindTap Course List)TrigonometryISBN:9781305652224Author:Charles P. McKeague, Mark D. TurnerPublisher:Cengage Learning