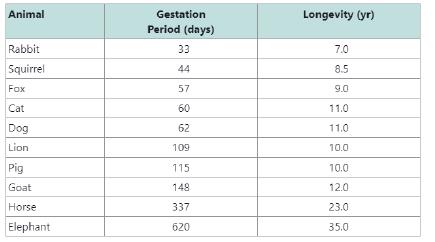
The table gives the average gestation period for selected animals and their corresponding average longevity. a. Graph the data in a scatter plot using the number of days for gestation as the independent variable x and the longevity as the dependent variable y . b. Use the data points (44, 8.5) and (620, 35) to write a linear function that defines longevity L x as a linear function of the length of the gestation period x . Round the slope to 3 decimal places and the y -intercept to 2 decimal places. c. Interpret the meaning of the slope in the context of this problem. d. Use the model from part (b) to predict the longevity for an animal with an 80-day gestation period. Round to the nearest year.
The table gives the average gestation period for selected animals and their corresponding average longevity. a. Graph the data in a scatter plot using the number of days for gestation as the independent variable x and the longevity as the dependent variable y . b. Use the data points (44, 8.5) and (620, 35) to write a linear function that defines longevity L x as a linear function of the length of the gestation period x . Round the slope to 3 decimal places and the y -intercept to 2 decimal places. c. Interpret the meaning of the slope in the context of this problem. d. Use the model from part (b) to predict the longevity for an animal with an 80-day gestation period. Round to the nearest year.
Solution Summary: The author explains how to graph the data in a scatter plot using the number of days for gestation as the independent variable x and the longevity
The table gives the average gestation period for selected animals and their corresponding average longevity.
a. Graph the data in a scatter plot using the number of days for gestation as the independent variable
x
and the longevity as the dependent variable
y
.
b. Use the data points (44, 8.5) and (620, 35) to write a linear function that defines longevity
L
x
as a linear function of the length of the gestation period
x
. Round the slope to 3 decimal places and the
y
-intercept
to 2 decimal places.
c. Interpret the meaning of the slope in the context of this problem.
d. Use the model from part (b) to predict the longevity for an animal with an 80-day gestation period. Round to the nearest year.
Formula Formula Point-slope equation: The point-slope equation of a line passing through the point (x 1 , y 1 ) with slope m , is given by the following formula: y - y 1 = m x - x 1 Example: The point-slope equation of a line passing through (2, -6) with slope 5 is given by: y - (-6) = 5(x - 2) y + 6 = 5(x - 2)
Consider the following system of equations, Ax=b :
x+2y+3z - w = 2
2x4z2w = 3
-x+6y+17z7w = 0
-9x-2y+13z7w = -14
a. Find the solution to the system. Write it as a parametric equation. You can use a
computer to do the row reduction.
b. What is a geometric description of the solution? Explain how you know.
c. Write the solution in vector form?
d. What is the solution to the homogeneous system, Ax=0?
2. Find a matrix A with the following qualities
a. A is 3 x 3.
b. The matrix A is not lower triangular and is not upper triangular.
c. At least one value in each row is not a 1, 2,-1, -2, or 0
d. A is invertible.
Need a deep-dive on the concept behind this application? Look no further. Learn more about this topic, calculus and related others by exploring similar questions and additional content below.
01 - What Is A Differential Equation in Calculus? Learn to Solve Ordinary Differential Equations.; Author: Math and Science;https://www.youtube.com/watch?v=K80YEHQpx9g;License: Standard YouTube License, CC-BY
Higher Order Differential Equation with constant coefficient (GATE) (Part 1) l GATE 2018; Author: GATE Lectures by Dishank;https://www.youtube.com/watch?v=ODxP7BbqAjA;License: Standard YouTube License, CC-BY


 Glencoe Algebra 1, Student Edition, 9780079039897...AlgebraISBN:9780079039897Author:CarterPublisher:McGraw Hill
 Algebra & Trigonometry with Analytic GeometryAlgebraISBN:9781133382119Author:SwokowskiPublisher:Cengage
 Algebra: Structure And Method, Book 1AlgebraISBN:9780395977224Author:Richard G. Brown, Mary P. Dolciani, Robert H. Sorgenfrey, William L. ColePublisher:McDougal Littell
 Holt Mcdougal Larson Pre-algebra: Student Edition...AlgebraISBN:9780547587776Author:HOLT MCDOUGALPublisher:HOLT MCDOUGAL
 Functions and Change: A Modeling Approach to Coll...AlgebraISBN:9781337111348Author:Bruce Crauder, Benny Evans, Alan NoellPublisher:Cengage Learning