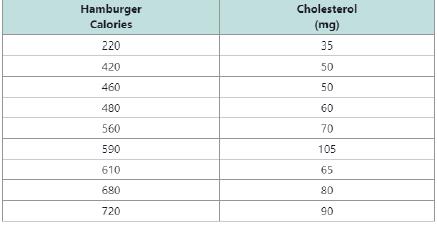
The table gives the number of calories and the amount of cholesterol for selected fast food hamburgers. a. Graph the data in a scatter plot using the number of calories as the independent variable x and the amount of cholesterol as the dependent variable y . b. Use the data points (480, 60) and (720, 90) to write a linear function that defines the amount of cholesterol c x as a linear function of the number of calories x . c. Interpret the meaning of the slope in the context of this problem. d. Use the model from part (b) to predict the amount of cholesterol for a hamburger with 650 calories.
The table gives the number of calories and the amount of cholesterol for selected fast food hamburgers. a. Graph the data in a scatter plot using the number of calories as the independent variable x and the amount of cholesterol as the dependent variable y . b. Use the data points (480, 60) and (720, 90) to write a linear function that defines the amount of cholesterol c x as a linear function of the number of calories x . c. Interpret the meaning of the slope in the context of this problem. d. Use the model from part (b) to predict the amount of cholesterol for a hamburger with 650 calories.
Solution Summary: The author illustrates how to graph the data in a scatter plot using the number of calories and the amount of cholesterol for selected fast food hamburgers.
The table gives the number of calories and the amount of cholesterol for selected fast food hamburgers.
a. Graph the data in a scatter plot using the number of calories as the independent variable
x
and the amount of cholesterol as the dependent variable
y
.
b. Use the data points (480, 60) and (720, 90) to write a linear function that defines the amount of cholesterol
c
x
as a linear function of the number of calories
x
.
c. Interpret the meaning of the slope in the context of this problem.
d. Use the model from part (b) to predict the amount of cholesterol for a hamburger with 650 calories.
Formula Formula Point-slope equation: The point-slope equation of a line passing through the point (x 1 , y 1 ) with slope m , is given by the following formula: y - y 1 = m x - x 1 Example: The point-slope equation of a line passing through (2, -6) with slope 5 is given by: y - (-6) = 5(x - 2) y + 6 = 5(x - 2)
1. A bicyclist is riding their bike along the Chicago Lakefront Trail. The velocity (in
feet per second) of the bicyclist is recorded below. Use (a) Simpson's Rule, and (b)
the Trapezoidal Rule to estimate the total distance the bicyclist traveled during the
8-second period.
t
0 2
4 6 8
V
10 15
12 10 16
2. Find the midpoint rule approximation for
(a) n = 4
+5
x²dx using n subintervals.
1° 2
(b) n = 8
36
32
28
36
32
28
24
24
20
20
16
16
12
8-
4
1
2
3
4
5
6
12
8
4
1
2
3
4
5
6
=
5 37
A 4 8 0.5
06
9
Consider the following system of equations, Ax=b :
x+2y+3z - w = 2
2x4z2w = 3
-x+6y+17z7w = 0
-9x-2y+13z7w = -14
a. Find the solution to the system. Write it as a parametric equation. You can use a
computer to do the row reduction.
b. What is a geometric description of the solution? Explain how you know.
c. Write the solution in vector form?
d. What is the solution to the homogeneous system, Ax=0?
Need a deep-dive on the concept behind this application? Look no further. Learn more about this topic, calculus and related others by exploring similar questions and additional content below.


 Glencoe Algebra 1, Student Edition, 9780079039897...AlgebraISBN:9780079039897Author:CarterPublisher:McGraw Hill
 Algebra: Structure And Method, Book 1AlgebraISBN:9780395977224Author:Richard G. Brown, Mary P. Dolciani, Robert H. Sorgenfrey, William L. ColePublisher:McDougal Littell
 Trigonometry (MindTap Course List)TrigonometryISBN:9781337278461Author:Ron LarsonPublisher:Cengage Learning
 Holt Mcdougal Larson Pre-algebra: Student Edition...AlgebraISBN:9780547587776Author:HOLT MCDOUGALPublisher:HOLT MCDOUGAL
 Algebra for College StudentsAlgebraISBN:9781285195780Author:Jerome E. Kaufmann, Karen L. SchwittersPublisher:Cengage Learning