
Concept explainers
Videos
A portion of a data set containing information for 45 mutual funds that are part of the Morningstar Funds 500 follows. The complete data set is available in the file named MutualFunds. The data set includes the following five variables:
Fund Type: The type of fund, labeled DE (Domestic Equity), IE (International Equity), and FI (Fixed Income).
Net Asset Value ($): The closing price per share on December 31, 2007.
5-Year Average Return (%): The average annual return for the fund over the past five years. Expense Ratio (%): The percentage of assets deducted each fiscal year for fund expenses. Morningstar Rank: The risk adjusted star rating for each fund; Morningstar ranks go from a low of 1-Star to a high of 5-Stars.
| Fund Name | Fund Type | Net Asset Value ($) | 5-Year Average Return (%) | Expense Ratio (%) | Morningstar Rank |
| Amer Cent Inc & Growth Inv | DE | 28.88 | 12.39 | .67 | 2-Star |
| American Century Intl. Disc | IE | 14.37 | 30.53 | 1.41 | 3-Star |
| American Century Tax-Free Bond | FI | 10.73 | 3.34 | .49 | 4-Star |
| American Century Ultra | DE | 24.94 | 10.88 | .99 | 3-Star |
| Ariel | DE | 46.39 | 11.32 | 1.03 | 2-Star |
| Artisan Intl Val | IE | 25.52 | 24.95 | 1.23 | 3-Star |
| Artisan Small Cap | DE | 16.92 | 15.67 | 1.18 | 3-Star |
| Baron Asset | DE | 50.67 | 16.77 | 1.31 | 5-Star |
| Brandywine | DE | 36.58 | 18.14 | 1.08 | 4-Star |
| . | . | . | . | . | . |
| . | . | . | . | . | . |
| . | . | . | . | . | . |
- a. Develop an estimated regression equation that can be used to predict the 5-year average return given the type of fund. At the .05 level of significance, test for a significant relationship.
- b. Did the estimated regression equation developed in part (a) provide a good fit to the data? Explain.
- c. Develop the estimated regression equation that can be used to predict the 5-year average return given the type of fund, the net asset value, and the expense ratio. At the .05 level of significance, test for a significant relationship. Do you think any variables should be deleted from the estimated regression equation? Explain.
- d. Morningstar Rank is a categorical variable. Because the data set contains only funds with four ranks (2-Star through 5-Star), use the following dummy variables: 3Star-Rank = 1 for a 3-Star fund, 0 otherwise; 4StarRank = 1 for a 4-Star fund, 0 otherwise; and 5StarRank = 1 for a 5-Star fund, 0 otherwise. Develop an estimated regression equation that can be used to predict the 5-year average return given the type of fund, the expense ratio, and the Morningstar Rank. Using a = .05, remove any independent variables that are not significant.
- e. Use the estimated regression equation developed in part (d) to predict the 5-year average return for a domestic equity fund with an expense ratio of 1.05% and a 3-Star Morningstar Rank.
a.
Find an estimated regression equation that could be used to predict the 5-year average return given the type of fund.
Perform a test to check the significant relationship between variables at
Answer to Problem 56SE
The estimated regression equation that could be used to predict the 5-year average return given the type of fund is
There is a significant relationship between dependent variable (y) and independent variables FundDE (
Explanation of Solution
Calculation:
The data related to the type of fund, net asset value, 5 year average return, expense ratio and management risk of 45 mutual funds.
Multiple linear regression model:
A multiple linear regression model is given as
The dummy variable FundDE is defined as is,
The dummy variable FundIE is defined as is,
Indicator variable:
Software procedure:
Step by step procedure to create indicator variable using MINITAB software is given as,
- Choose Calc>Make Indicator variables.
- InMake indicator variables for, enterFund Type.
- In Distinct Value, enter 1 for DE and0 for IE, FI.
- Click OK.
The indicator variable is stored in the column of ‘FundDE’.
Software procedure:
Step by step procedure to create indicator variable using MINITAB software is given as,
- Choose Calc>Make Indicator variables.
- InMake indicator variables for, enterDrive.
- In Distinct Value, enter 1 for IE and0 for DE, FI.
- Click OK.
The indicator variable is stored in the column of ‘FundIE’.
In the given problem, five year average return be the dependent variable (y), FundDE be the independent variable (
Regression:
Software procedure:
Step by step procedure to obtain regression equation using MINITAB software is given as,
- Choose Stat > Regression > Regression > Fit Regression Model.
- Under Responses, enter the column of y.
- Under Continuous predictors, enter the columns ofFundDE, FundIE.
- Click OK.
Output using MINITAB software is given below:
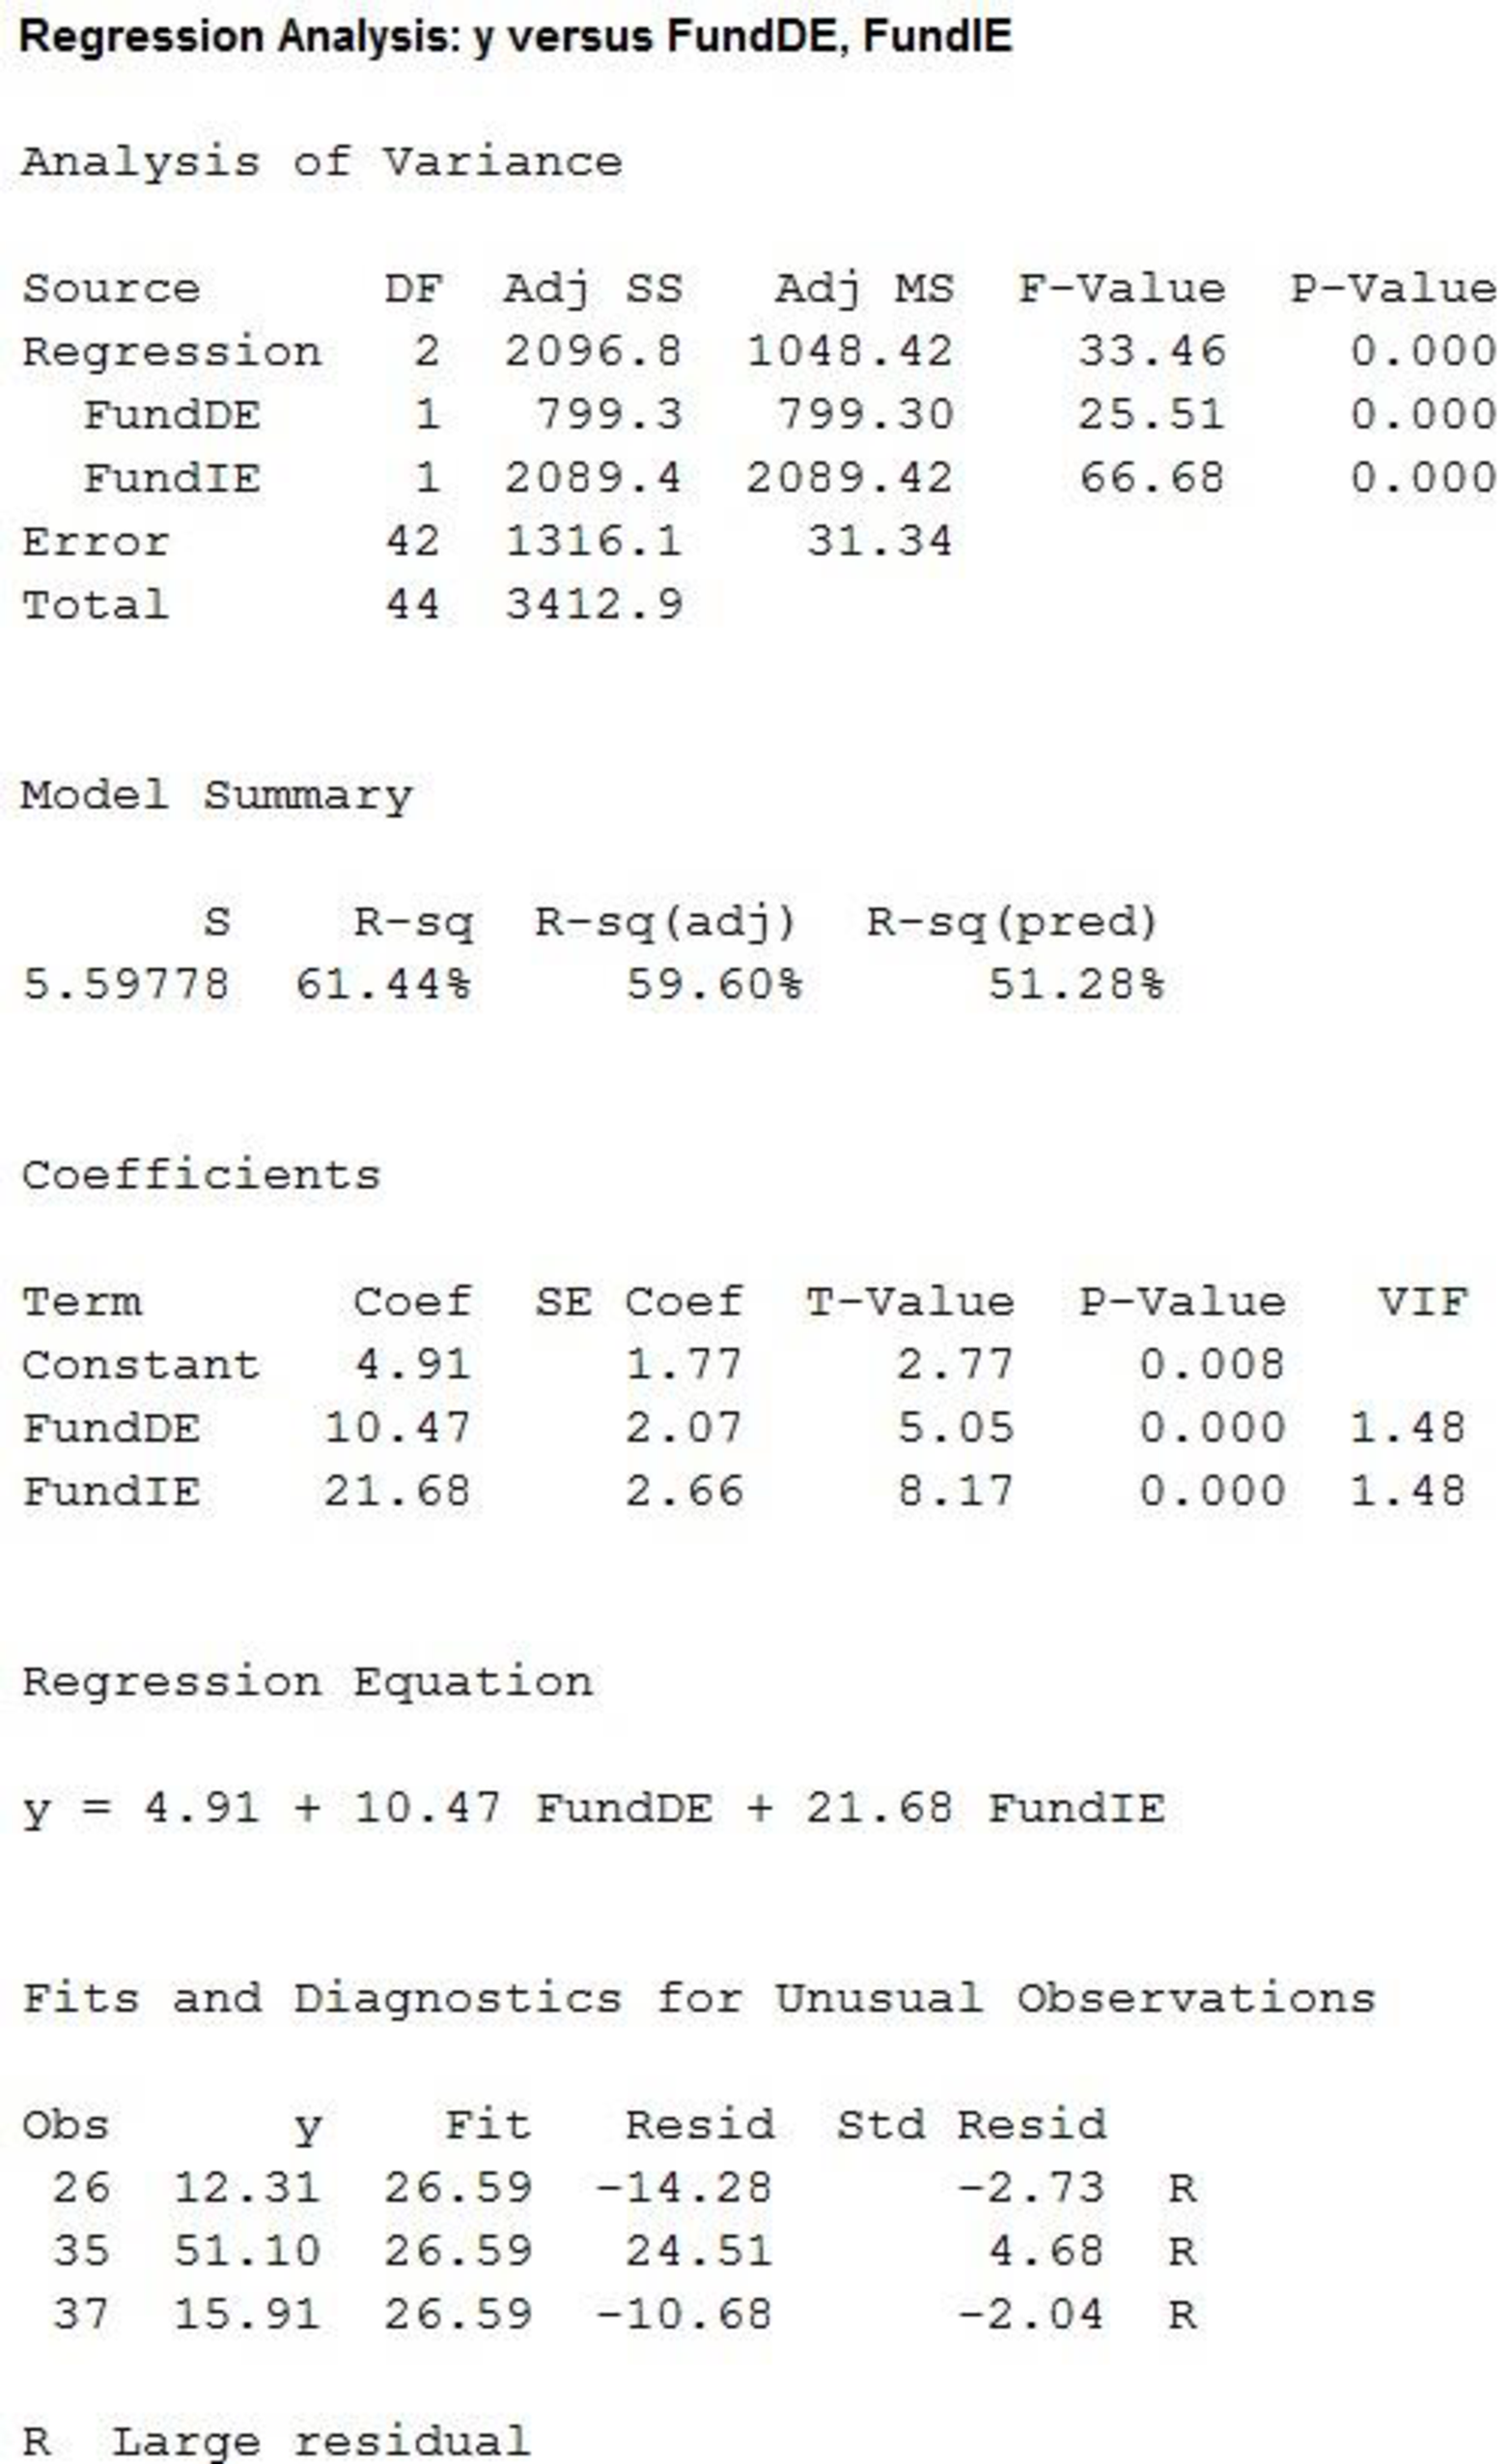
Thus, the estimated regression equation that could be used to predict the 5-year average return given the type of fund is
State the test hypotheses.
Null hypothesis:
That is, there is not a significant relationship between dependent variable (y) and independent variables FundDE (
Alternative hypothesis:
That is, there is a significant relationship between dependent variable (y) and independent variables FundDE (
According the output, it is found that the F statistic with numerator df of 1 and denominator df of 42, corresponding to regression is 33.4584 and the p value for F statistic corresponding to regression is 0.000.
Level of significance:
The given level of significance is
Rejection rule:
If the
Conclusion:
Here, the p-value is less than the level of significance.
That is,
Thus, the decision is “reject the null hypothesis”.
Therefore, the data provide sufficient evidence to conclude that there is a significant relationship between dependent variable (y) and independent variables FundDE (
b.
Whether the estimated regression equation in part (a) provides a good fit.
Explanation of Solution
The coefficient of determination (
In the given output,
Thus, the percentage of variation in the observed values of dependent variable that is explained by the regression is 61.44%, which indicates that 61.44% of the variability in dependent variable is explained by the variability in independent variables using the linear regression model.
Thus, the model provides a good fit.
c.
Find an estimated regression equation that could be used to predict the 5-year average return given the type of fund, the net asset value and the expense ratio.
Perform a test to check the significant relationship between variables at
Explain whether any variable should be deleted from the estimated regression equation.
Answer to Problem 56SE
The estimated regression equation that could be used to predict the 5-year average return given the type of fund, the net asset value and the expense ratio is
There is a significant relationship between dependent variable (y) and independent variables FundDE (
The Net Asset value should be deleted from the estimated regression equation.
Explanation of Solution
Calculation:
Here, five year average return be the dependent variable (y), FundDE (
Regression:
Software procedure:
Step by step procedure to obtain regression equation using MINITAB software is given as,
- Choose Stat > Regression > Regression > Fit Regression Model.
- Under Responses, enter the column of y.
- Under Continuous predictors, enter the columns ofFundDE, FundIE, Net Asset Value, and Expense Ratio.
- Click OK.
Output using MINITAB software is given below:
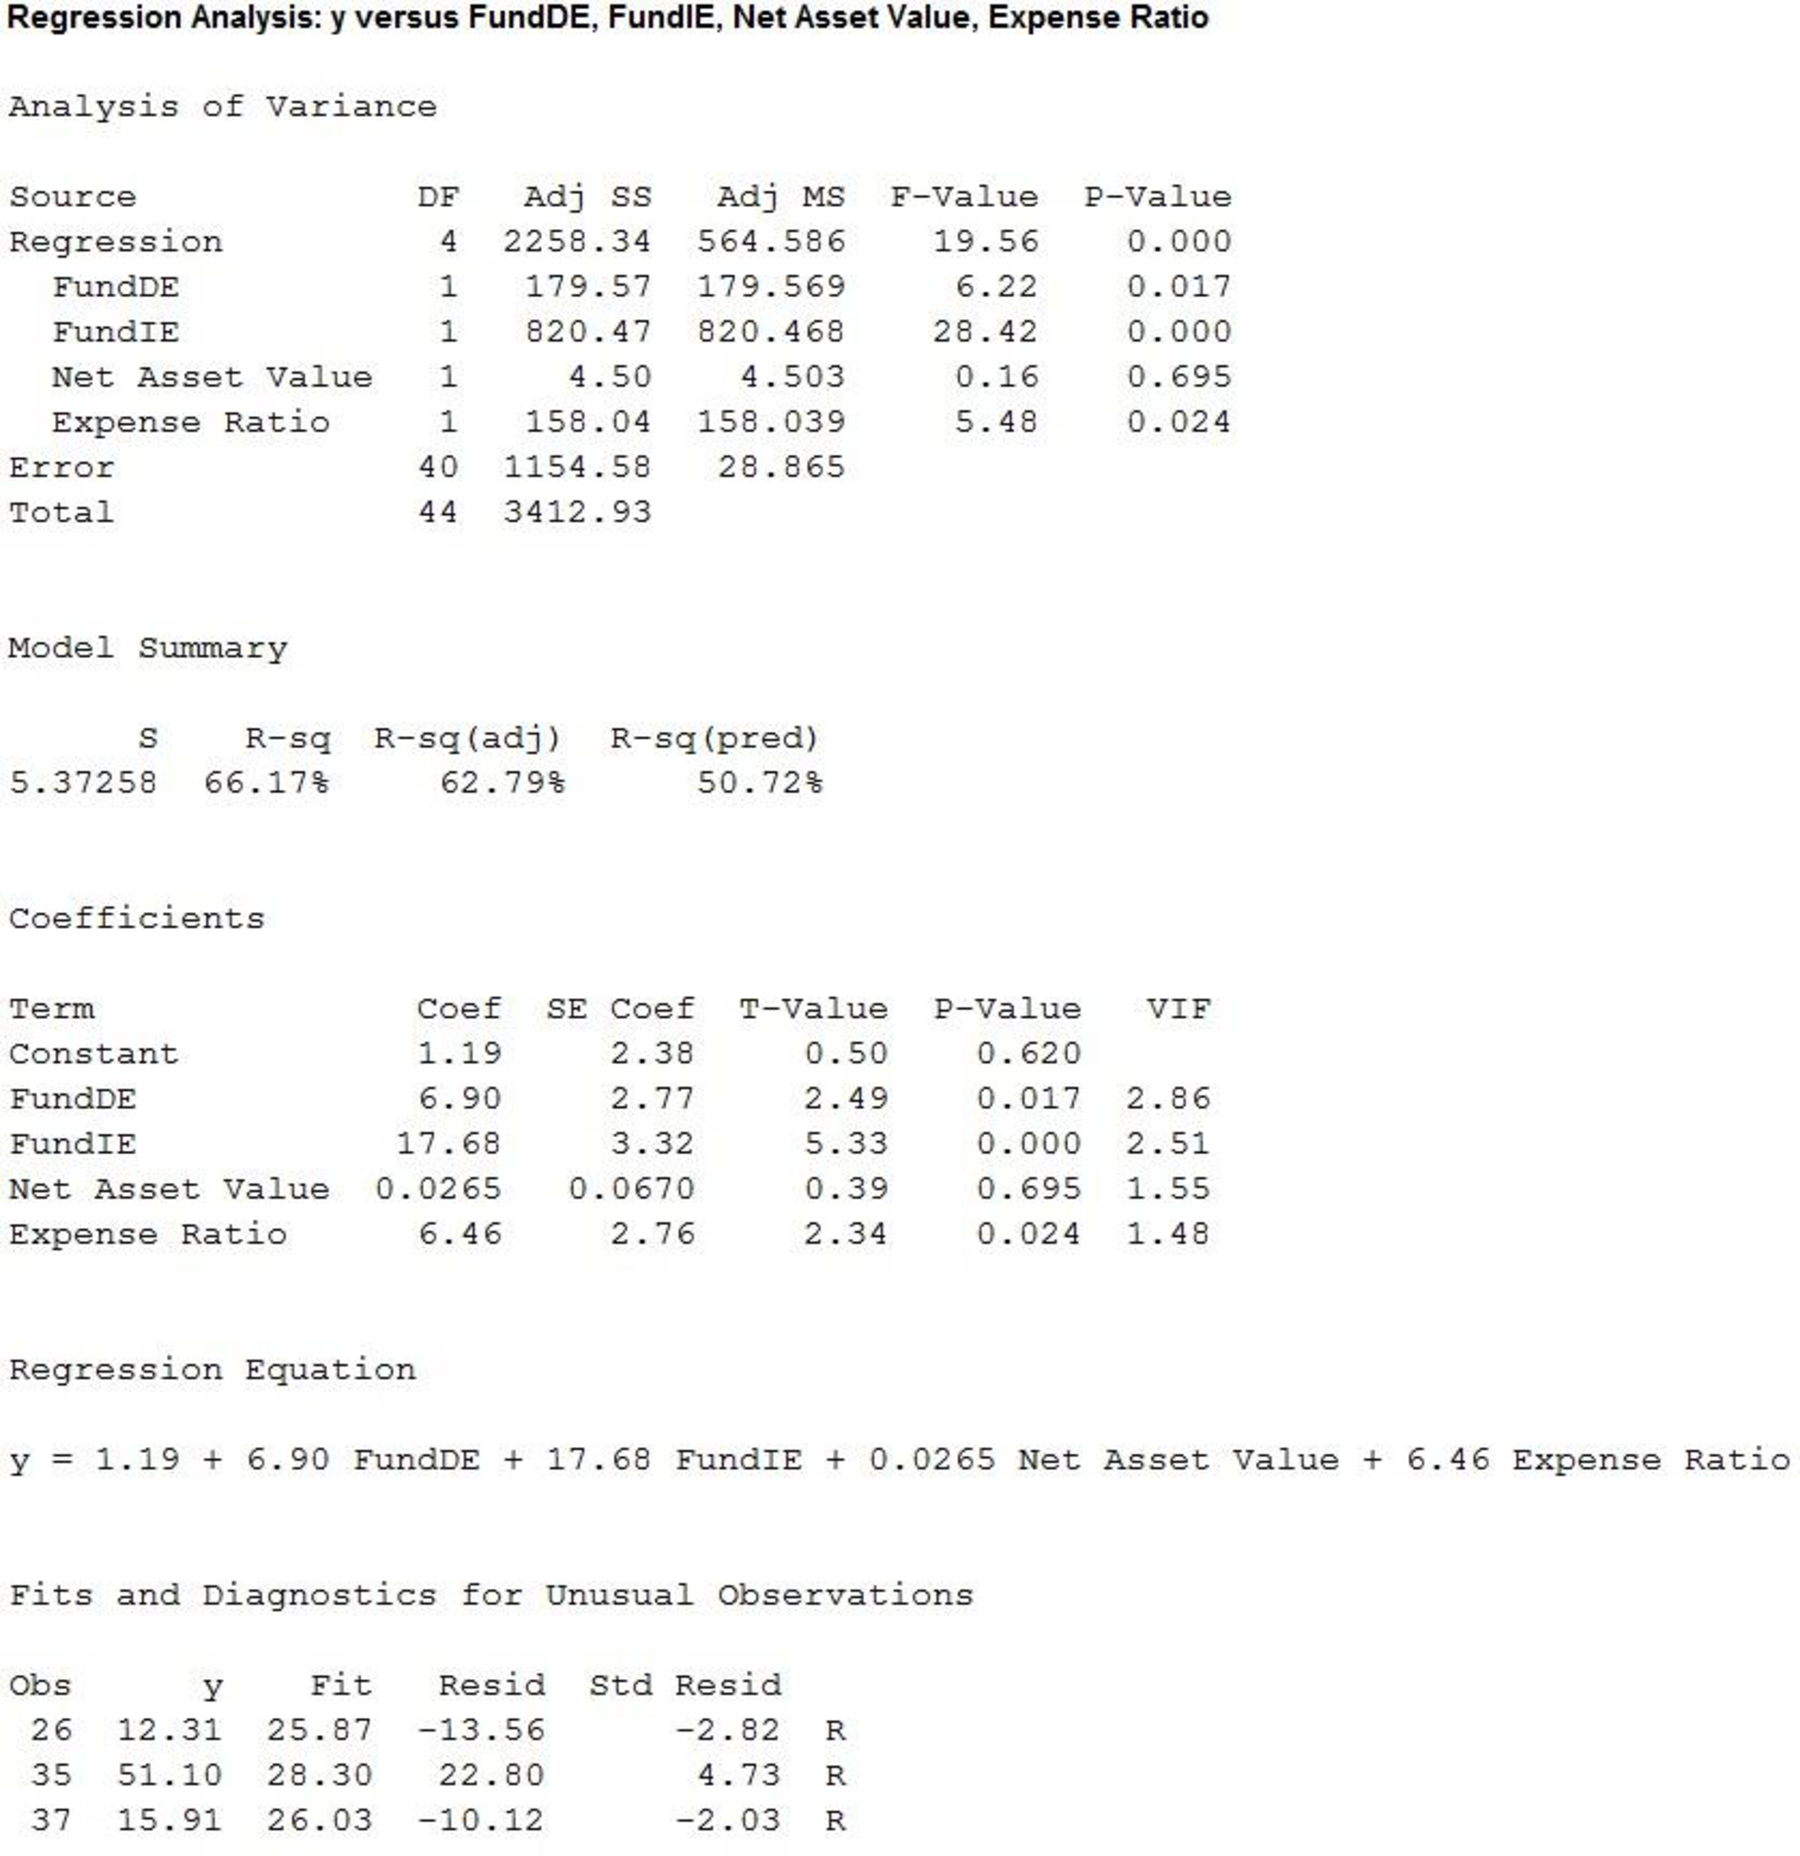
Thus,the estimated regression equation that could be used to predict the 5-year average return given the type of fund, the net asset value and the expense ratio is
State the test hypotheses.
Null hypothesis:
That is, there is not a significant relationship between dependent variable (y) and independent variables FundDE (
Alternative hypothesis:
That is, there is a significant relationship between dependent variable (y) and independent variables FundDE (
According the output, it is found that the F statistic with numerator df of 1 and denominator df of 40, corresponding to regression is 19.5598 and the p value for F statistic corresponding to regression is 0.000.
Level of significance:
The given level of significance is
Rejection rule:
If the
Conclusion:
Here, the p-value is less than the level of significance.
That is,
Thus, the decision is “reject the null hypothesis”.
Therefore, the data provide sufficient evidence to conclude that there is a significant relationship between dependent variable (y) and independent variables FundDE (
State the test hypotheses.
Null hypothesis:
That is, the addition of the independent variable FundDE is not significant.
Alternative hypothesis:
That is, the addition of the independent variable FundDE is significant.
From the output, it is found that the t statistic corresponding to FundDE is 2.7651 with df of 40 and the p value is 0.017.
Level of significance:
Assume the level of significance is
Rejection rule:
If the
Conclusion:
Here, the p-value is less than the level of significance.
That is,
Thus, the decision is “reject the null hypothesis”.
Therefore, the data provide sufficient evidence to conclude that the addition of the independent variable FundDE is significant.
State the test hypotheses.
Null hypothesis:
That is, the addition of the FundIE is not significant.
Alternative hypothesis:
That is, the addition of the FundIE is significant.
From the output, it is found that the t statistic corresponding to FundIE is 5.3315 with df of 40 and the p value is 0.000.
Level of significance:
Assume the level of significance is
Rejection rule:
If the
Conclusion:
Here, the p-value is less than the level of significance.
That is,
Thus, the decision is “reject the null hypothesis”.
Therefore, the data provide sufficient evidence to conclude that the addition of the dummy variableFundIE is significant.
State the test hypotheses.
Null hypothesis:
That is, the addition of the Net Asset Value is not significant.
Alternative hypothesis:
That is, the addition of the Net Asset Value is significant.
From the output, it is found that the t statistic corresponding to Net Asset Value is 0.6950 with df of 40 and the p value is 0.695.
Level of significance:
Assume the level of significance is
Rejection rule:
If the
Conclusion:
Here, the p-value is greater than the level of significance.
That is,
Thus, the decision is “fail to reject the null hypothesis”.
Therefore, the data provide sufficient evidence to conclude that the addition of the Net Asset Value is significant.
State the test hypotheses.
Null hypothesis:
That is, the addition of the Expense Ratio is not significant.
Alternative hypothesis:
That is, the addition of the Expense Ratio is significant.
From the output, it is found that the t statistic corresponding to Expense Ratio is 2.3399 with df of 40 and the p value is 0.024.
Level of significance:
Assume the level of significance is
Rejection rule:
If the
Conclusion:
Here, the p-value is less than the level of significance.
That is,
Thus, the decision is “reject the null hypothesis”.
Therefore, the data provide sufficient evidence to conclude that the addition of the Expense Ratio is significant.
Thus, Net Asset value is not significant and it should be deleted from the estimated regression equation.
d.
Find an estimated regression equation that could be used to predict the 5-year average return given the type of fund, the expense ratio and the Morningstar Rank.
Perform a test at
Answer to Problem 56SE
The estimated regression equation that could be used to predict the 5-year average return given the type of fund, the expense ratio and the Morningstar Rank is
None of the independent variables are deleted from the regression equation.
Explanation of Solution
Calculation:
The dummy variable 3StarRank is defined as is,
The dummy variable 4StarRank is defined as is,
The dummy variable 5StarRank is defined as is,
Indicator variable:
Software procedure:
Step by step procedure to create indicator variable using MINITAB software is given as,
- Choose Calc>Make Indicator variables.
- InMake indicator variables for, enterMorningstar Rank.
- In Distinct Value, enter 1 for 3-Star and0 for 2-Star, 4-Star, 5-Star.
- Click OK.
The indicator variable is stored in the column of ‘3StarRank’.
Software procedure:
Step by step procedure to create indicator variable using MINITAB software is given as,
- Choose Calc>Make Indicator variables.
- InMake indicator variables for, enterMorningstar Rank.
- In Distinct Value, enter 1 for 4-Star and0 for 2-Star, 3-Star, 5-Star.
- Click OK.
The indicator variable is stored in the column of ‘4StarRank’.
Software procedure:
Step by step procedure to create indicator variable using MINITAB software is given as,
- Choose Calc>Make Indicator variables.
- InMake indicator variables for, enterMorningstar Rank.
- In Distinct Value, enter 1 for 5-Star and0 for 2-Star, 3-Star, 4-Star.
- Click OK.
The indicator variable is stored in the column of ‘5StarRank’.
Here, five year average return be the dependent variable (y), FundDE (
Regression:
Software procedure:
Step by step procedure to obtain regression equation using MINITAB software is given as,
- Choose Stat > Regression > Regression > Fit Regression Model.
- Under Responses, enter the column of y.
- Under Continuous predictors, enter the columns ofFundDE, FundIE, Expense Ratio,3StarRank, 4StarRank and5StarRank.
- Click OK.
Output using MINITAB software is given below:
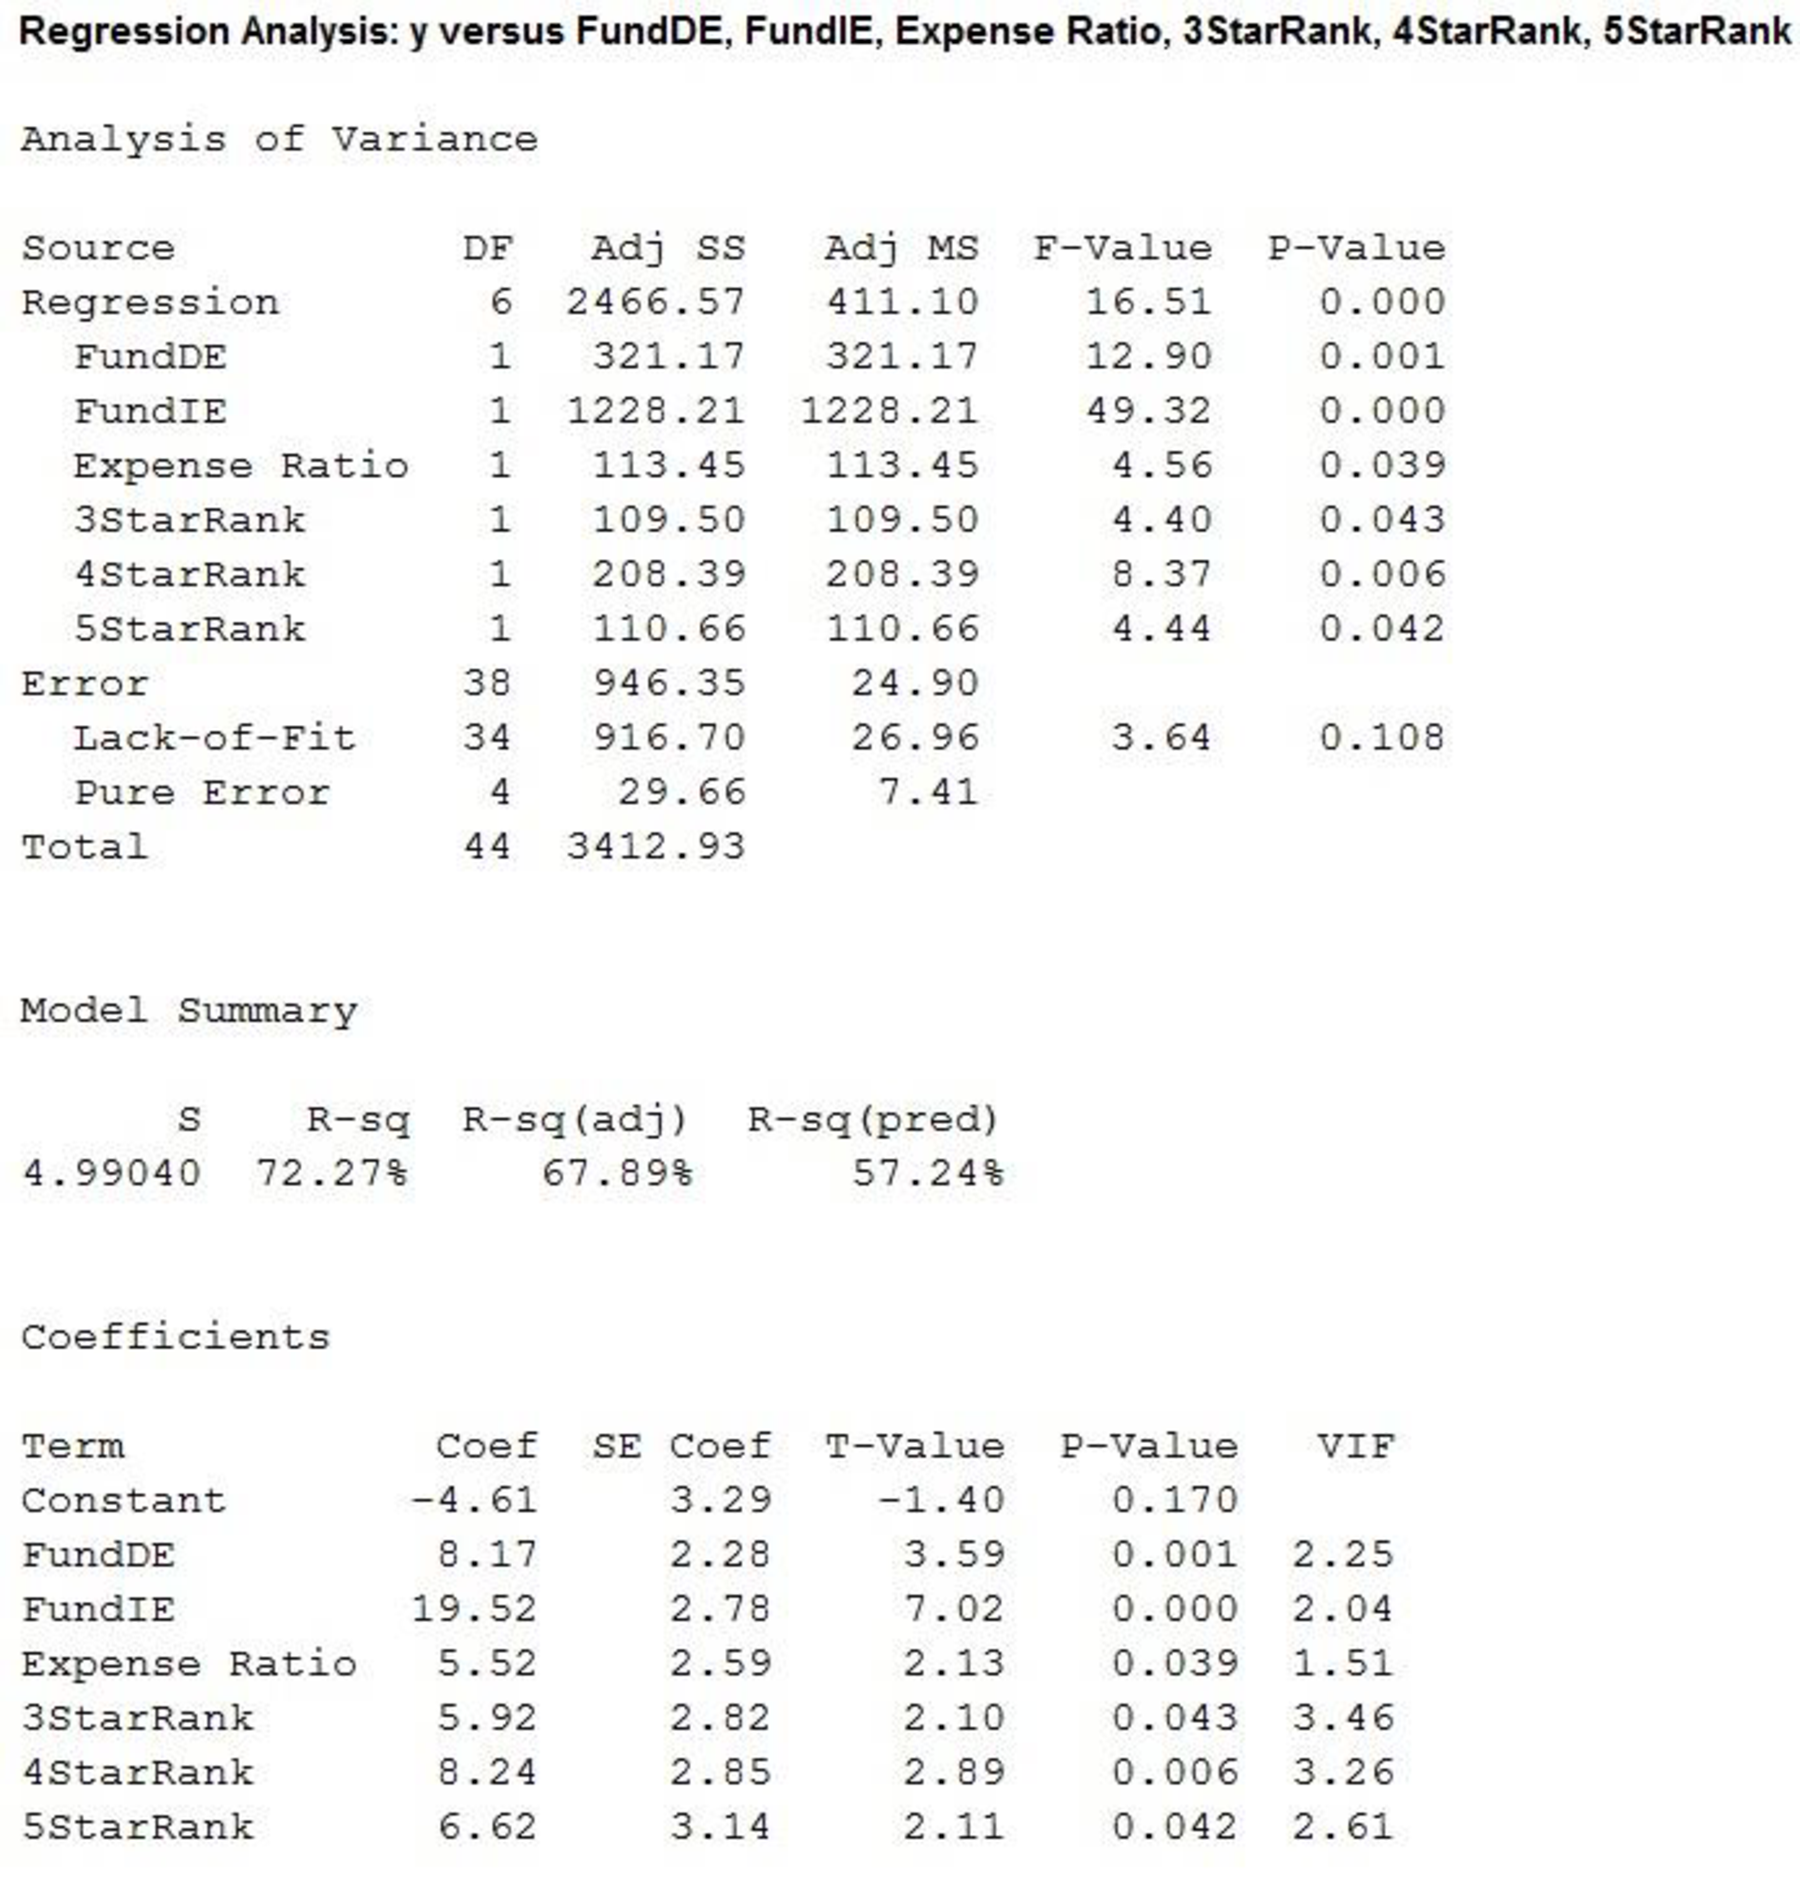
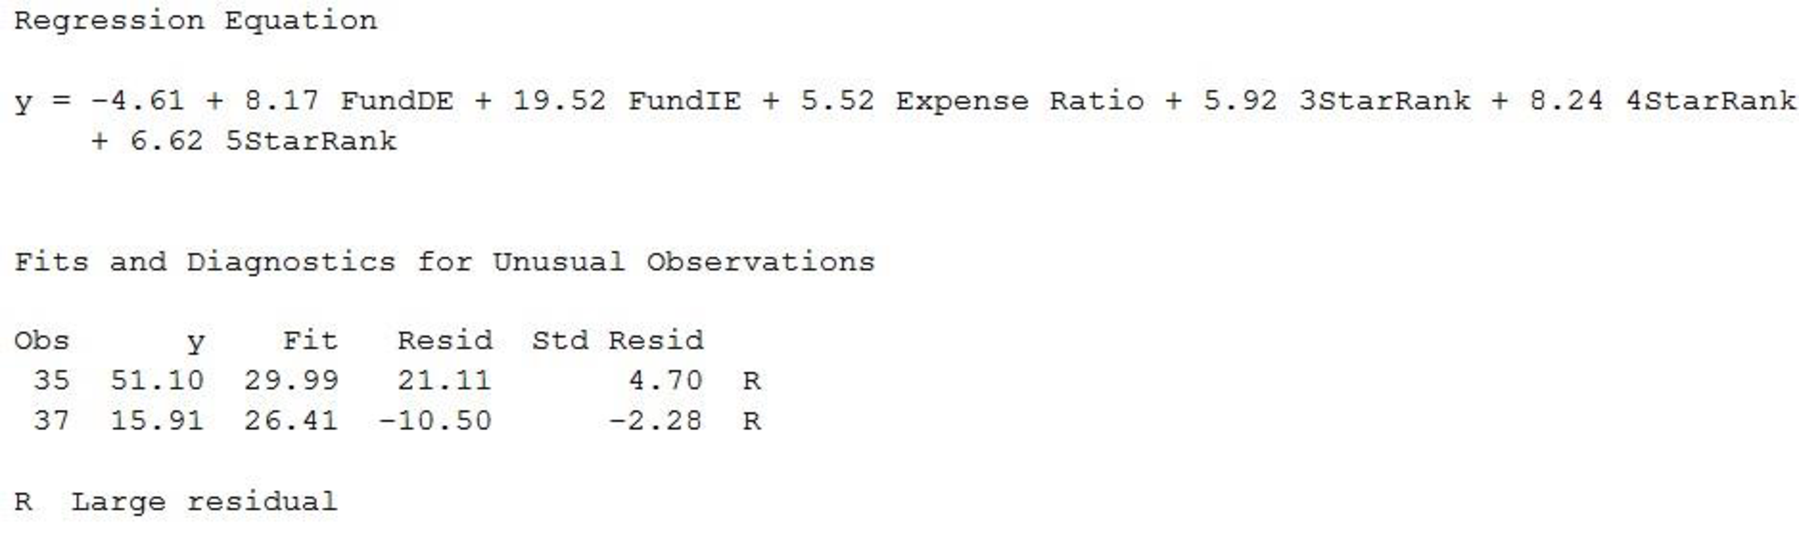
Thus, the estimated regression equation that could be used to predict the 5-year average return given the type of fund, the expense ratio and the Morningstar Rank is
State the test hypotheses.
Null hypothesis:
That is, the addition of the independent variable FundDE is not significant.
Alternative hypothesis:
That is, the addition of the independent variable FundDE is significant.
From the output, it is found that the t statistic corresponding to FundDE is 3.59 with df of 38 and the p value is 0.001.
Level of significance:
Assume the level of significance is
Rejection rule:
If the
Conclusion:
Here, the p-value is less than the level of significance.
That is,
Thus, the decision is “reject the null hypothesis”.
Therefore, the data provide sufficient evidence to conclude that the addition of the independentvariable FundDE is significant.
State the test hypotheses.
Null hypothesis:
That is, the addition of the FundIE is not significant.
Alternative hypothesis:
That is, the addition of the FundIE is significant.
From the output, it is found that the t statistic corresponding to FundIE is 7.02 with df of 38 and the p value is 0.000.
Level of significance:
Assume the level of significance is
Rejection rule:
If the
Conclusion:
Here, the p-value is less than the level of significance.
That is,
Thus, the decision is “reject the null hypothesis”.
Therefore, the data provide sufficient evidence to conclude that the addition of the dummy variableFundIE is significant.
State the test hypotheses.
Null hypothesis:
That is, the addition of the Expense Ratio is not significant.
Alternative hypothesis:
That is, the addition of the Expense Ratio is significant.
From the output, it is found that the t statistic corresponding to Expense Ratio is 2.13 with df of 38 and the p value is 0.039.
Level of significance:
Assume the level of significance is
Rejection rule:
If the
Conclusion:
Here, the p-value is less than the level of significance.
That is,
Thus, the decision is “reject the null hypothesis”.
Therefore, the data provide sufficient evidence to conclude that the addition of the Expense Ratio is significant.
State the test hypotheses.
Null hypothesis:
That is, the addition of the 3StarRank is not significant.
Alternative hypothesis:
That is, the addition of the 3StarRank is significant.
From the output, it is found that the t statistic corresponding to 3StarRank is 2.10 with df of 38 and the p value is 0.043.
Level of significance:
Assume the level of significance is
Rejection rule:
If the
Conclusion:
Here, the p-value is less than the level of significance.
That is,
Thus, the decision is “reject the null hypothesis”.
Therefore, the data provide sufficient evidence to conclude that the addition of the 3StarRank is significant.
State the test hypotheses.
Null hypothesis:
That is, the addition of the 4StarRank is not significant.
Alternative hypothesis:
That is, the addition of the 4StarRank is significant.
From the output, it is found that the t statistic corresponding to 4StarRank is 2.89 with df of 38 and the p value is 0.006.
Level of significance:
Assume the level of significance is
Rejection rule:
If the
Conclusion:
Here, the p-value is less than the level of significance.
That is,
Thus, the decision is “reject the null hypothesis”.
Therefore, the data provide sufficient evidence to conclude that the addition of the 4StarRank is significant.
State the test hypotheses.
Null hypothesis:
That is, the addition of the 5StarRank is not significant.
Alternative hypothesis:
That is, the addition of the 5StarRank is significant.
From the output, it is found that the t statistic corresponding to 5StarRank is 2.11 with df of 38 and the p value is 0.042.
Level of significance:
Assume the level of significance is
Rejection rule:
If the
Conclusion:
Here, the p-value is less than the level of significance.
That is,
Thus, the decision is “reject the null hypothesis”.
Therefore, the data provide sufficient evidence to conclude that the addition of the 5StarRank is significant.
Thus, all the independent variables are significant and no independent variables are deleted from the regression equation.
e.
Predict the 5-year average return for a domestic equality fund with an expense ratio of 1.05% and a 3-star Morningstar Rank.
Answer to Problem 56SE
The predicted the 5-year average return for a domestic equality fund with an expense ratio of 1.05% and a 3-star Morningstar Rank is 15.28%.
Explanation of Solution
Calculation:
According to part (d) the estimated regression equation that could be used to predict the 5-year average return given the type of fund, the expense ratio and the Morningstar Rank is
The 5-year average return for a domestic equality fund with an expense ratio of 1.05% and a 3-star Morningstar Rank implies that,
Thus, the predicted the 5-year average return for a domestic equality fund with an expense ratio of 1.05% and a 3-star Morningstar Rank is,
Thus, the predicted the 5-year average return for a domestic equality fund with an expense ratio of 1.05% and a 3-star Morningstar Rank is 15.28%.
Want to see more full solutions like this?
Chapter 15 Solutions
CENGAGENOW FOR ANDERSON/SWEENEY/WILLIAM


- Problem 3 In their lab, engineer Daniel and Paulina are desperately trying to perfect time travel. But the problem is that their machine still struggles with power inconsistencies-sometimes generating too little energy, other times too much, causing unstable time jumps. To prevent catastrophic misjumps into the Jurassic era or the far future, they must calibrate the machine's power output. After extensive testing, they found that the time machine's power output follows a normal distribution, with an average energy level of 8.7 gigawatts and a standard deviation of 1.2 gigawatts. The Time Travel Safety Board has set strict guidelines: For a successful time jump, the machine's power must be between 8.5 and 9.5 gigawatts. What is the probability that a randomly selected time jump meets this precision requirement? Daniel suggests that adjusting the mean power output could improve time-travel accuracy. Can adjusting the mean reduce the number of dangerous misjumps? If yes, what should the…arrow_forwardProblem 5 ( Marybeth is also interested in the experiment from Problem 2 (associated with the enhancements for Captain America's shield), so she decides to start a detailed literature review on the subject. Among others, she found a paper where they used a 2"(4-1) fractional factorial design in the factors: (A) shield material, (B) throwing mechanism, (C) edge modification, and (D) handle adjustment. The experimental design used in the paper is shown in the table below. a. Run A B с D 1 (1) -1 -1 -1 1 2 a 1 -1 -1 1 3 bd -1 1 -1 1 4 abd 1 1 -1 1 5 cd -1 -1 1 -1 6 acd 1 -1 1 -1 7 bc -1 1 1 -1 abc 1 1 1 -1 paper? s) What was the generator used in the 2"(4-1) fractional factorial design described in the b. Based on the resolution of this design, what do you think about the generator used in the paper? Do you think it was a good choice, or would you have selected a different one? Explain your answer in detail.arrow_forwardSuppose we wish to test the hypothesis that women with a sister’s history of breast cancer are at higher risk of developing breast cancer themselves. Suppose we assume that the prevalence rate of breast cancer is 3% among 60- to 64-year-old U.S. women, whereas it is 5% among women with a sister history. We propose to interview 400 women 40 to 64 years of age with a sister history of the disease. What is the power of such a study assuming that the level of significance is 10%? I only need help writing the null and alternative hypotheses.arrow_forward
- 4.96 The breaking strengths for 1-foot-square samples of a particular synthetic fabric are approximately normally distributed with a mean of 2,250 pounds per square inch (psi) and a standard deviation of 10.2 psi. Find the probability of selecting a 1-foot-square sample of material at random that on testing would have a breaking strength in excess of 2,265 psi.4.97 Refer to Exercise 4.96. Suppose that a new synthetic fabric has been developed that may have a different mean breaking strength. A random sample of 15 1-foot sections is obtained, and each section is tested for breaking strength. If we assume that the population standard deviation for the new fabric is identical to that for the old fabric, describe the sampling distribution forybased on random samples of 15 1-foot sections of new fabricarrow_forwardUne Entreprise œuvrant dans le domaine du multividéo donne l'opportunité à ses programmeurs-analystes d'évaluer la performance des cadres supérieurs. Voici les résultats obtenues (sur une échelle de 10 à 50) où 50 représentent une excellente performance. 10 programmeurs furent sélectionnés au hazard pour évaluer deux cadres. Un rapport Excel est également fourni. Programmeurs Cadre A Cadre B 1 34 36 2 32 34 3 18 19 33 38 19 21 21 23 7 35 34 8 20 20 9 34 34 10 36 34 Test d'égalité des espérances: observations pairéesarrow_forwardA television news channel samples 25 gas stations from its local area and uses the results to estimate the average gas price for the state. What’s wrong with its margin of error?arrow_forward
- You’re fed up with keeping Fido locked inside, so you conduct a mail survey to find out people’s opinions on the new dog barking ordinance in a certain city. Of the 10,000 people who receive surveys, 1,000 respond, and only 80 are in favor of it. You calculate the margin of error to be 1.2 percent. Explain why this reported margin of error is misleading.arrow_forwardYou find out that the dietary scale you use each day is off by a factor of 2 ounces (over — at least that’s what you say!). The margin of error for your scale was plus or minus 0.5 ounces before you found this out. What’s the margin of error now?arrow_forwardSuppose that Sue and Bill each make a confidence interval out of the same data set, but Sue wants a confidence level of 80 percent compared to Bill’s 90 percent. How do their margins of error compare?arrow_forward
- Suppose that you conduct a study twice, and the second time you use four times as many people as you did the first time. How does the change affect your margin of error? (Assume the other components remain constant.)arrow_forwardOut of a sample of 200 babysitters, 70 percent are girls, and 30 percent are guys. What’s the margin of error for the percentage of female babysitters? Assume 95 percent confidence.What’s the margin of error for the percentage of male babysitters? Assume 95 percent confidence.arrow_forwardYou sample 100 fish in Pond A at the fish hatchery and find that they average 5.5 inches with a standard deviation of 1 inch. Your sample of 100 fish from Pond B has the same mean, but the standard deviation is 2 inches. How do the margins of error compare? (Assume the confidence levels are the same.)arrow_forward
 Glencoe Algebra 1, Student Edition, 9780079039897...AlgebraISBN:9780079039897Author:CarterPublisher:McGraw Hill