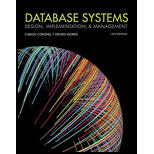
Database Systems: Design, Implementation, & Management
13th Edition
ISBN: 9781337627900
Author: Carlos Coronel, Steven Morris
Publisher: Cengage Learning
expand_more
expand_more
format_list_bulleted
Question
Chapter 15, Problem 1RQ
Program Plan Intro
Database is an organized data collection, and every data present is related to each other in some way. It contains the occurrences of data to satisfy the needs of the user in an organization.
Expert Solution & Answer
Explanation of Solution
Database Connectivity and uses:
- Database connectivity includes the application programs used for communicating with storage device like database repository.
- It has the information of both software application and hardware database and thereby, it is also known as database middleware.
- The data repository which is a data management application is used for storing the applications, data and information required.
- The data repository can be located anywhere in the database in the form of relational database, hierarchical database, spreadsheet or text.
- It has the ability of creating database structures on storage requirements.
- It has complex structures which can be accessed by multi-users.
- It stores the data definitions and Metadata in a directory or dictionary and the changes made to that definitions and Metadata will be automatically updated in directory or dictionary.
- It has the ability of performing data backup and recovery which assures the data safety.
- It represents the usability of data and the data is affected only in allowed ways during the database transaction.
- Data independence is the ability of accessing the programs which are independent of storage characteristics of data.
- In multiprogramming, the users are allowed to complete the tasks simultaneously without effecting the other transactions.
Want to see more full solutions like this?
Subscribe now to access step-by-step solutions to millions of textbook problems written by subject matter experts!
Students have asked these similar questions
Generate a random sample of standard lognormal data (rlnorm()) for sample size n = 100. Construct histogram estimates of density for this sample using Sturges’ Rule, Scott’s Normal Reference Rule, and the FD Rule.
Can I get help with this case please, thank you
I need help to solve the following, thank you
Chapter 15 Solutions
Database Systems: Design, Implementation, & Management
Knowledge Booster
Similar questions
- reminder it an exercice not a grading work GETTING STARTED Open the file SC_EX19_EOM2-1_FirstLastNamexlsx, available for download from the SAM website. Save the file as SC_EX19_EOM2-1_FirstLastNamexlsx by changing the “1” to a “2”. If you do not see the .xlsx file extension in the Save As dialog box, do not type it. The program will add the file extension for you automatically. With the file SC_EX19_EOM2-1_FirstLastNamexlsx still open, ensure that your first and last name is displayed in cell B6 of the Documentation sheet. If cell B6 does not display your name, delete the file and download a new copy from the SAM website. Brad Kauffman is the senior director of projects for Rivera Engineering in Miami, Florida. The company performs engineering projects for public utilities and energy companies. Brad has started to create an Excel workbook to track estimated and actual hours and billing amounts for each project. He asks you to format the workbook to make the…arrow_forwardNeed help completing this algorithm here in coding! 2arrow_forwardWhats wrong the pseudocode here??arrow_forward
- Help! how do I fix my python coding question for this? (my code also provided)arrow_forwardNeed help with coding in this in python!arrow_forwardIn the diagram, there is a green arrow pointing from Input C (complete data) to Transformer Encoder S_B, which I don’t understand. The teacher model is trained on full data, but S_B should instead receive missing data—this arrow should not point there. Please verify and recreate the diagram to fix this issue. Additionally, the newly created diagram should meet the same clarity standards as the second diagram (Proposed MSCATN). Finally provide the output image of the diagram in image format .arrow_forward
- Please provide me with the output image of both of them . below are the diagrams code make sure to update the code and mentionned clearly each section also the digram should be clearly describe like in the attached image. please do not provide the same answer like in other question . I repost this question because it does not satisfy the requirment I need in terms of clarifty the output of both code are not very well details I have two diagram : first diagram code graph LR subgraph Teacher Model (Pretrained) Input_Teacher[Input C (Complete Data)] --> Teacher_Encoder[Transformer Encoder T] Teacher_Encoder --> Teacher_Prediction[Teacher Prediction y_T] Teacher_Encoder --> Teacher_Features[Internal Features F_T] end subgraph Student_A_Model[Student Model A (Handles Missing Values)] Input_Student_A[Input M (Data with Missing Values)] --> Student_A_Encoder[Transformer Encoder E_A] Student_A_Encoder --> Student_A_Prediction[Student A Prediction y_A] Student_A_Encoder…arrow_forwardWhy I need ?arrow_forwardHere are two diagrams. Make them very explicit, similar to Example Diagram 3 (the Architecture of MSCTNN). graph LR subgraph Teacher_Model_B [Teacher Model (Pretrained)] Input_Teacher_B[Input C (Complete Data)] --> Teacher_Encoder_B[Transformer Encoder T] Teacher_Encoder_B --> Teacher_Prediction_B[Teacher Prediction y_T] Teacher_Encoder_B --> Teacher_Features_B[Internal Features F_T] end subgraph Student_B_Model [Student Model B (Handles Missing Labels)] Input_Student_B[Input C (Complete Data)] --> Student_B_Encoder[Transformer Encoder E_B] Student_B_Encoder --> Student_B_Prediction[Student B Prediction y_B] end subgraph Knowledge_Distillation_B [Knowledge Distillation (Student B)] Teacher_Prediction_B -- Logits Distillation Loss (L_logits_B) --> Total_Loss_B Teacher_Features_B -- Feature Alignment Loss (L_feature_B) --> Total_Loss_B Partial_Labels_B[Partial Labels y_p] -- Prediction Loss (L_pred_B) --> Total_Loss_B Total_Loss_B -- Backpropagation -->…arrow_forward
arrow_back_ios
SEE MORE QUESTIONS
arrow_forward_ios
Recommended textbooks for you
 Fundamentals of Information SystemsComputer ScienceISBN:9781337097536Author:Ralph Stair, George ReynoldsPublisher:Cengage Learning
 Principles of Information Systems (MindTap Course...Computer ScienceISBN:9781305971776Author:Ralph Stair, George ReynoldsPublisher:Cengage Learning
 Enhanced Discovering Computers 2017 (Shelly Cashm...Computer ScienceISBN:9781305657458Author:Misty E. Vermaat, Susan L. Sebok, Steven M. Freund, Mark Frydenberg, Jennifer T. CampbellPublisher:Cengage Learning
 Database Systems: Design, Implementation, & Manag...Computer ScienceISBN:9781305627482Author:Carlos Coronel, Steven MorrisPublisher:Cengage Learning
 Principles of Information Systems (MindTap Course...Computer ScienceISBN:9781285867168Author:Ralph Stair, George ReynoldsPublisher:Cengage Learning

Fundamentals of Information Systems
Computer Science
ISBN:9781337097536
Author:Ralph Stair, George Reynolds
Publisher:Cengage Learning

Principles of Information Systems (MindTap Course...
Computer Science
ISBN:9781305971776
Author:Ralph Stair, George Reynolds
Publisher:Cengage Learning

Enhanced Discovering Computers 2017 (Shelly Cashm...
Computer Science
ISBN:9781305657458
Author:Misty E. Vermaat, Susan L. Sebok, Steven M. Freund, Mark Frydenberg, Jennifer T. Campbell
Publisher:Cengage Learning

Database Systems: Design, Implementation, & Manag...
Computer Science
ISBN:9781305627482
Author:Carlos Coronel, Steven Morris
Publisher:Cengage Learning

Principles of Information Systems (MindTap Course...
Computer Science
ISBN:9781285867168
Author:Ralph Stair, George Reynolds
Publisher:Cengage Learning
