
Concept explainers
Videos
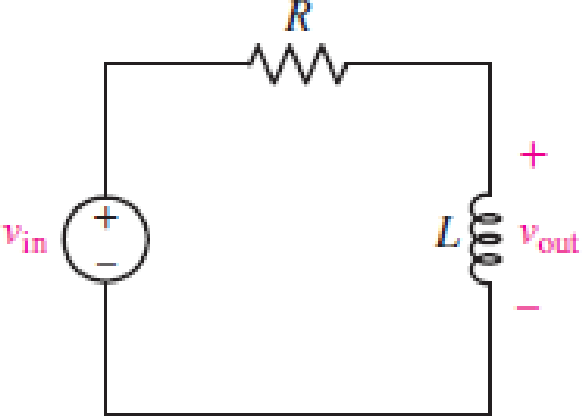
For the RL circuit in Fig. 15.52, (a) determine the transer function defined as H(jω) = vout/vin; (b) for the case of R = 200 Ω and L = 5 mH, construct a plot of the magnitude and phase as a function of frequency; and (c) evaluate the magnitude and phase at a frequency of 10 kHz.
FIGURE 15.52
(a)
Find the transfer function
Answer to Problem 1E
The transfer function
Explanation of Solution
Given data:
Refer to Figure 15.52 in the textbook.
Formula used:
Write the expression to calculate the impedance of the passive elements resistor and inductor.
Here,
Calculation:
The given RL circuit is drawn as Figure 1.
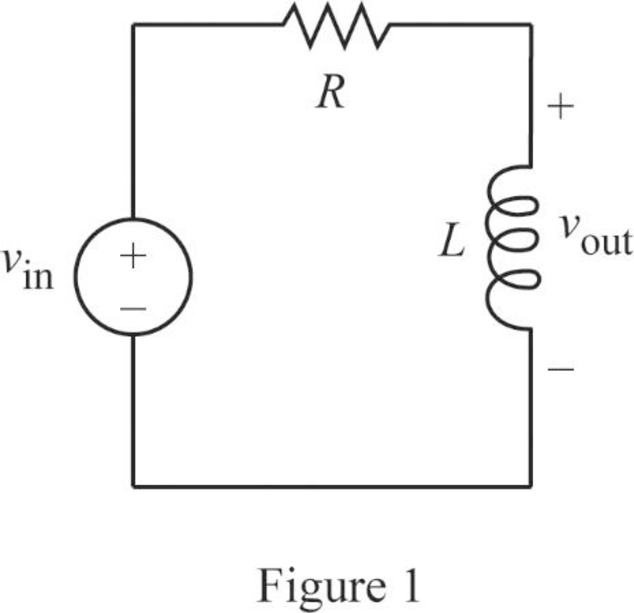
The Figure 1 is redrawn as impedance circuit in Figure 2 using the equations (1) and (2).
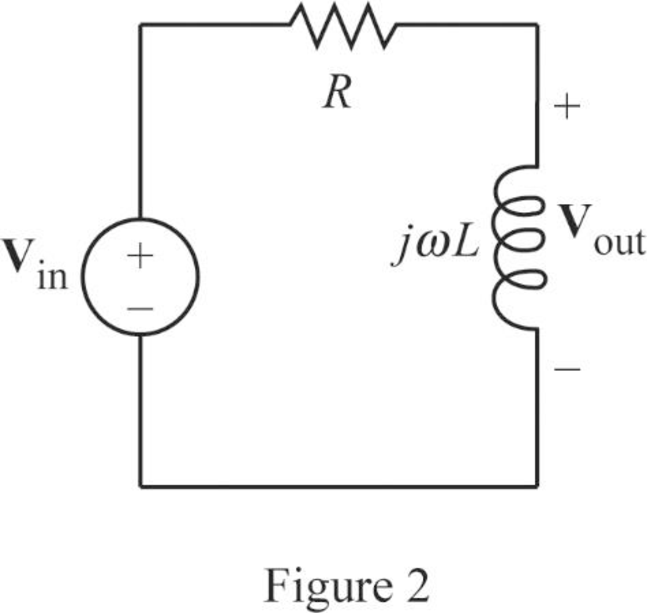
Write the general expression to calculate the transfer function of the circuit in Figure 2.
Here,
Apply Kirchhoff’s voltage law on Figure 2 to find
Rearrange the above equation to find
Substitute
Conclusion:
Thus, the transfer function
(b)
Plot the magnitude and phase as a function of frequency.
Explanation of Solution
Given data:
The value of the resistor
The value of the inductor
Calculation:
From part (a), the transfer function is,
Substitute
Simplify the above equation to find
Re-write the transfer function
From equation (4), the magnitude function of
Write the above equation in decibel (dB).
From equation (4), the phase angle is expressed as follows:
Substitute
Substitute
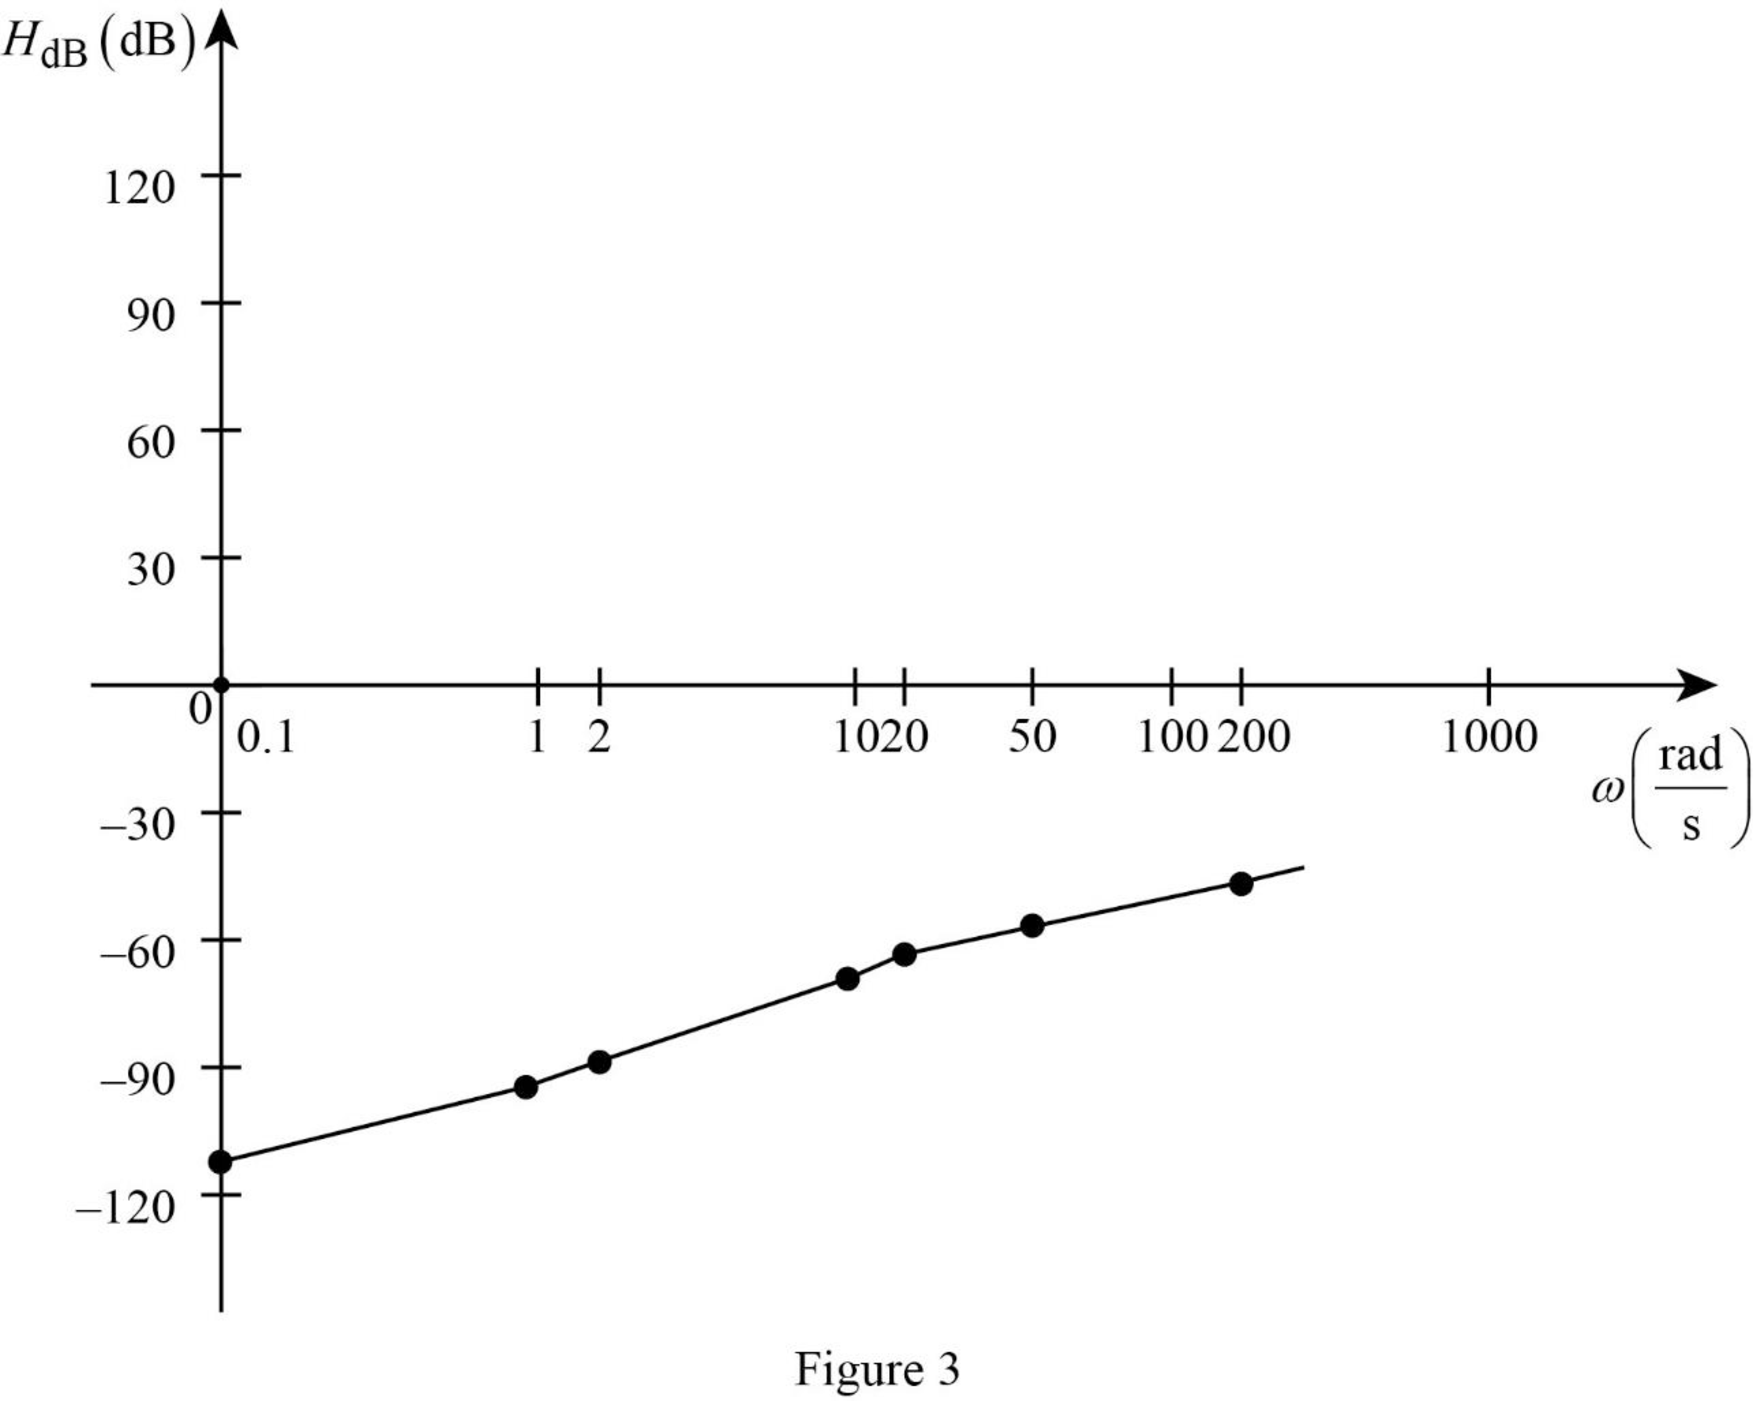
Similarly, by substituting various values for
Table 1
| 0.1 | 1 | 2 | 10 | 20 | 50 | 200 | |
| –112 | –92 | –86 | –72 | –66 | –58 | –46 |
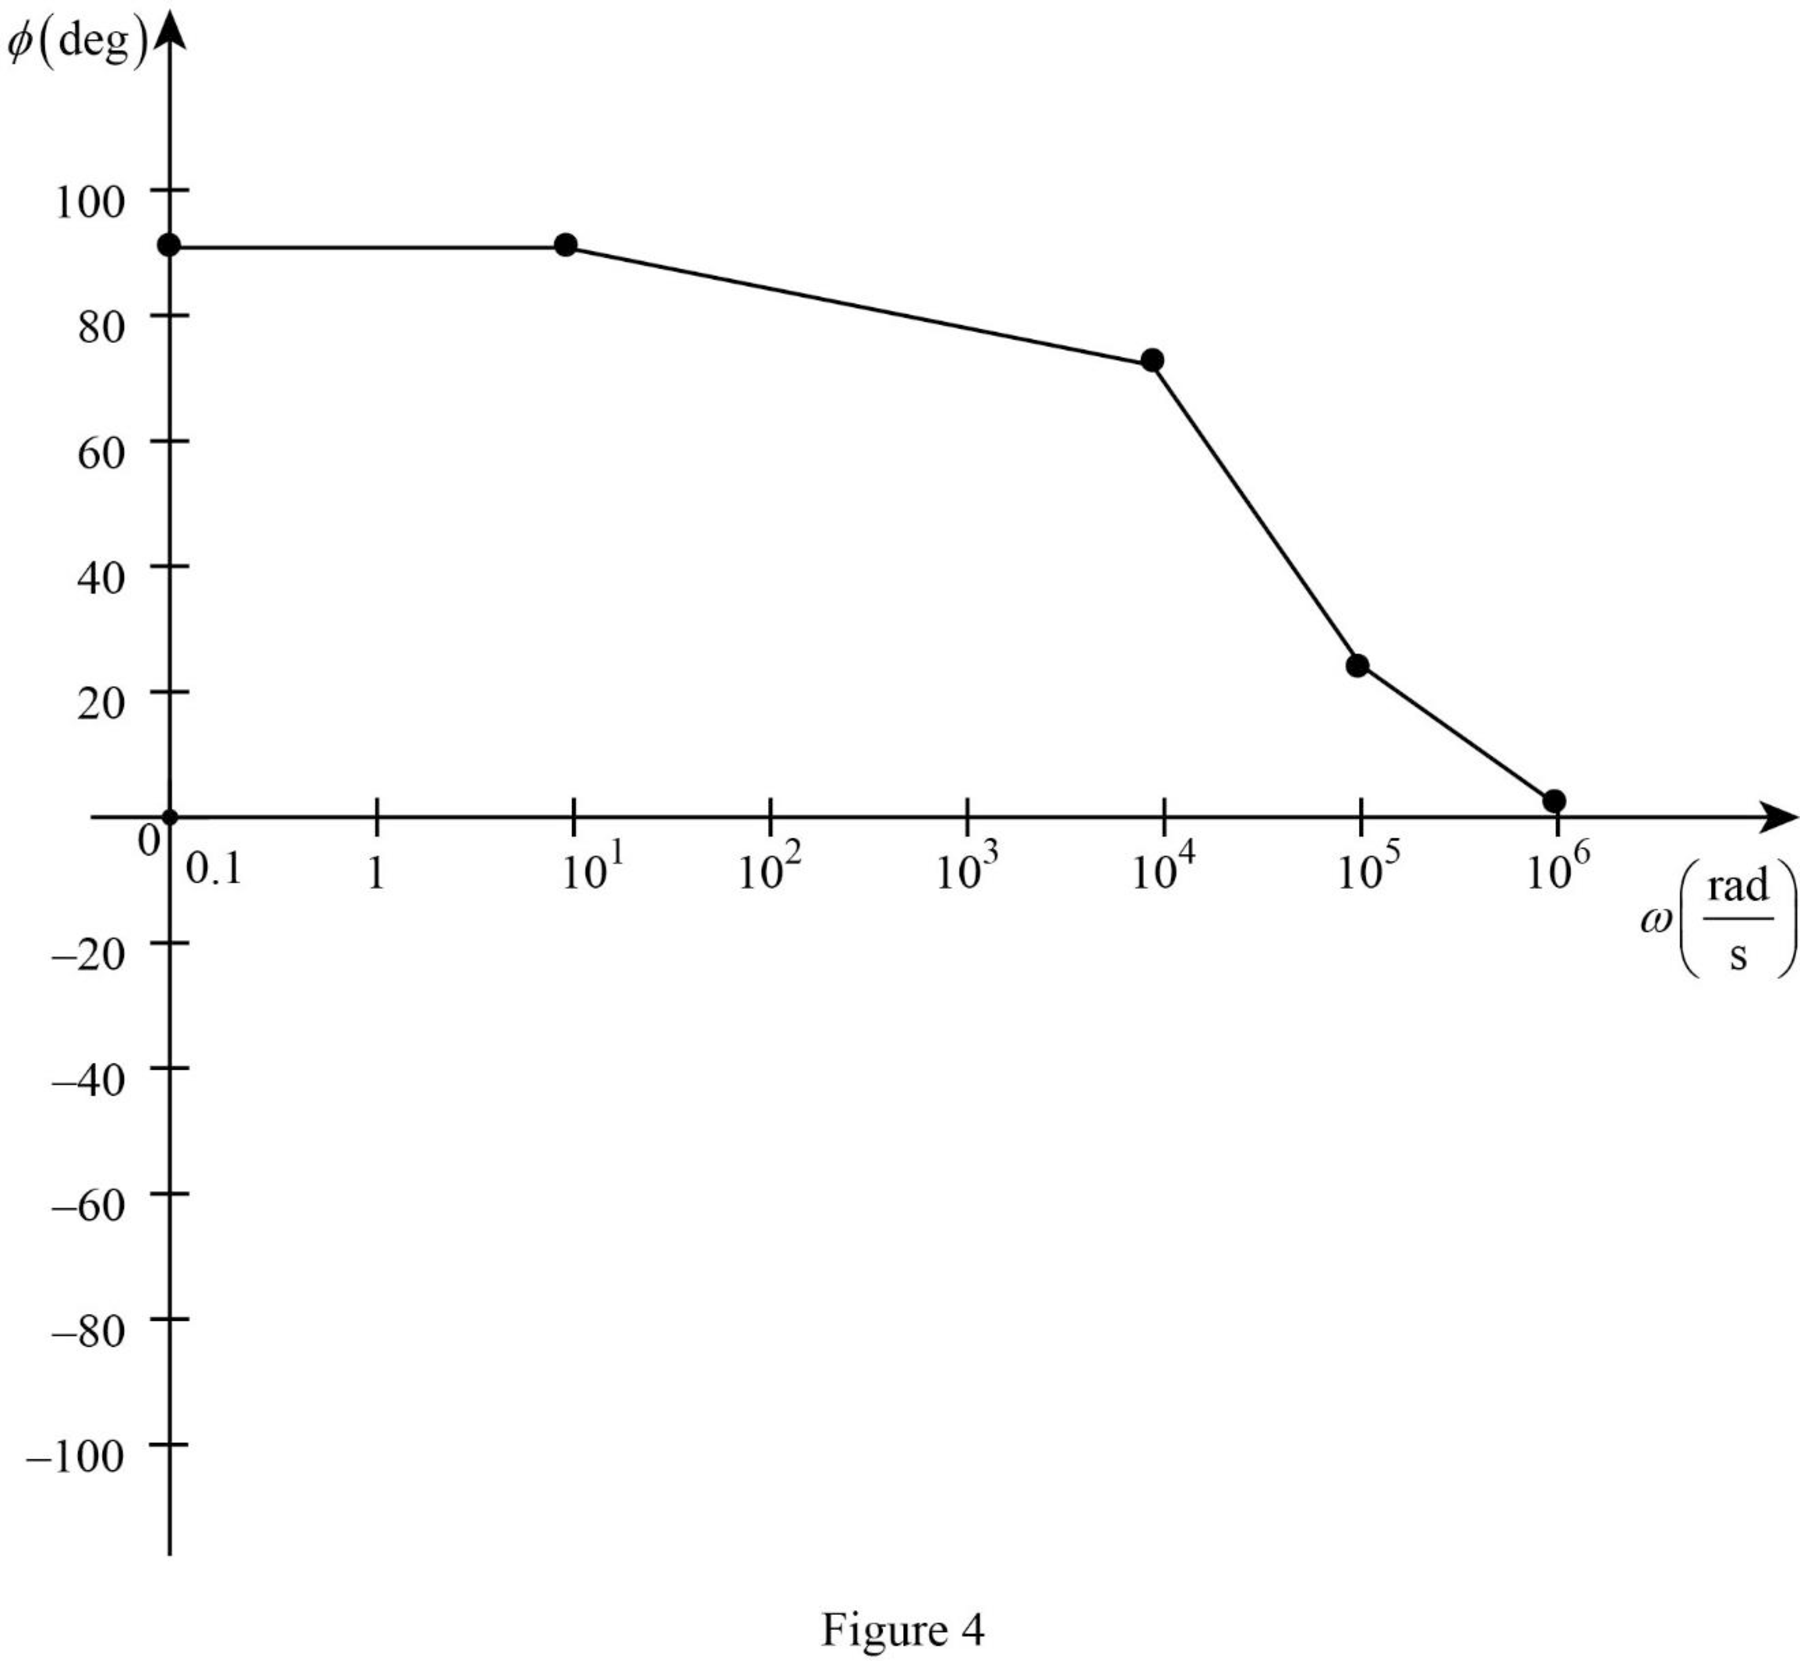
Table 2
| 0.1 | 10 | 104 | 105 | 106 | |
| 90 | 90 | 75.96 | 21.8 | 2.3 |
The Figure 1 is the magnitude plot of the given transfer function obtained using Table 1.
The Figure 2 is the phase plot of the given transfer function obtained using Table 2.
Conclusion:
Thus, the magnitude and phase as a function of frequency is plotted.
(c)
Find the value of the magnitude and phase at a frequency of
Answer to Problem 1E
The value of the magnitude and phase at a frequency of
Explanation of Solution
Given data:
The value of the frequency
Formula used:
Write the expression to calculate the angular frequency.
Here,
Calculation:
From part (a), the transfer function is expressed as,
From equation (7), the magnitude function is expressed as,
Substitute
Substitute
From equation (7), the phase function is expressed as,
Substitute
Substitute
Conclusion:
Thus, the value of the magnitude and phase at a frequency of
Want to see more full solutions like this?
Chapter 15 Solutions
Loose Leaf for Engineering Circuit Analysis Format: Loose-leaf
Additional Engineering Textbook Solutions
Management Information Systems: Managing The Digital Firm (16th Edition)
Starting Out with Java: From Control Structures through Objects (7th Edition) (What's New in Computer Science)
SURVEY OF OPERATING SYSTEMS
Starting Out with Programming Logic and Design (5th Edition) (What's New in Computer Science)
Electric Circuits. (11th Edition)
Concepts Of Programming Languages


- DU 1. Describe the operations of Q1, Q2 and LM566. 2. Describe the functions of VR1 and VR2. R6 lk R3 BRUD 3. If the input frequency is higher than the FSK frequency, does the FSK modulator operate normally? 0+12V R10 5.6k 6 10k VRI 500k U₁ LM566 3 VCO output 7 Digital input R₁ VR2 10k ww 1k Qi C945 C945 C5 I 0.1 uF C6 luF C₁ 0.01μ R2 10k ww R$ 100k C3 +12V 0.01μ R9 100k +12V 6 R710k Rs 100k 6 R4 100k P FSK output ww ww + www + 3 3 4 U U₂ 1000p -12V HA741 1000p-12V µА741 Fig. 13-2 FSK modulator CTS circuit.arrow_forward. 30-dB, right-circularly polarized antenna in a radio link radiates 5-W of power t 2 GHz. The input impedance of this antenna is 75 ohms, and it is attached ɔ a 50-ohm transmission line. The receiving antenna has an impedance mismatch at its terminals, - which leads to a VSWR of 2. The receiving antenna is about 95% efficient and has a field pattern near the beam maximum given by E, = (2âx + jây) F, (0, 0). The distance between the two antennas is 4,000 km, and the receiving antenna Directivity is 100. Determine the Minimum power Delivered to receiving antenna. 1arrow_forwardOpen plc - ladder logic To control traffic, we have red lights to stop cars and green lights to initiate entry/exit. If a car is in the lane, then the red lights turn ON. If no cars are in the lane, then the green lights turn ON. Upon turning ON the main switch button, the main switch indicator should turn ON and the system should start with green lights ON and red lights OFF?arrow_forward
- 3-4) 3.4-2 Signals g₁(t) = 104П(104) and g2(t) = 8(t) are applied at the inputs of the ideal low-pass filters H₁(f)=(f/20,000) and H2(f) = П(f/10,000) (Fig. P3.4-2). The outputs y₁ (t) and y2(t) of these filters are multiplied to obtain the signal y(t) = y1 (1)y2(t). (a) Sketch G1(f) and G2(f). (b) Sketch H₁(f) and H₂(f). (c) Sketch Y₁ (f) and Y2(f). (d) Find the bandwidths of y₁ (t), y2(t), and y(t). 8₁ (1) H₁(f) y, (t) y(t) = y₁ (1) y2 (1) 82(1) ½⁄2 (1) H₂(f)arrow_forwardsolve the differential equation y'' -2y'-3y=x³e^5x cos(3x) Don't use AI,I need it handwrittenarrow_forward3-3) Similar to Lathi & Ding prob. 3.3-7. The signals in the figure below are modulated signals with carrier cos(5t). Find the Fourier transforms of these signals using the appropriate properties of the Fourier transform and text Table 3.1. The sketch the magnitude and phase spectra for figure parts (a) and (b). Hint: these functions can be expressed in the form g(t) cos(2лfot) (a) 1 1 2π www. σπ (b) (c) όπarrow_forward
- 3-1) Similar to Lathi & Ding prob. 3.1-1. Use direct integration to find the Fourier transforms of the signals shown below. a) g₁(t) = II(t − 2) + 2 exp (−3|t|) b) g(t) = d(t+2)+3e¯u (t − 2)arrow_forward3-2) Lathi & Ding prob. 3.1-5. From the definition in eq. 3.1b, find the inverse Fourier transforms of the spectra in the figure below. G(f) COS лf 10 (a) G(f) 1 -B B (b)arrow_forwardFundamentals of Energy Systems HW 4 Q2arrow_forward
 Introductory Circuit Analysis (13th Edition)Electrical EngineeringISBN:9780133923605Author:Robert L. BoylestadPublisher:PEARSON
 Delmar's Standard Textbook Of ElectricityElectrical EngineeringISBN:9781337900348Author:Stephen L. HermanPublisher:Cengage Learning
 Programmable Logic ControllersElectrical EngineeringISBN:9780073373843Author:Frank D. PetruzellaPublisher:McGraw-Hill Education
 Fundamentals of Electric CircuitsElectrical EngineeringISBN:9780078028229Author:Charles K Alexander, Matthew SadikuPublisher:McGraw-Hill Education
 Electric Circuits. (11th Edition)Electrical EngineeringISBN:9780134746968Author:James W. Nilsson, Susan RiedelPublisher:PEARSON
 Engineering ElectromagneticsElectrical EngineeringISBN:9780078028151Author:Hayt, William H. (william Hart), Jr, BUCK, John A.Publisher:Mcgraw-hill Education,