Concept explainers
Exercises 1 through 4 refer to the data set shown in Table 15-12. The table shows the scores on a Chem 103 test consisting of 10 questions worth 10 points each.
Chem 103 test scores.
Table 15-12
Chem 103 test scores
| Student ID | Score | Student ID | Score |
| 1362 | 50 | 4315 | 70 |
| 1486 | 70 | 4719 | 70 |
| 1721 | 80 | 4951 | 60 |
| 1932 | 60 | 5321 | 60 |
| 2489 | 70 | 5872 | 100 |
| 2766 | 10 | 6433 | 50 |
| 2877 | 80 | 6921 | 50 |
| 2964 | 60 | 8317 | 70 |
| 3217 | 70 | 8854 | 100 |
| 3588 | 80 | 8964 | 80 |
| 3780 | 80 | 9158 | 60 |
| 3921 | 60 | 9347 | 60 |
| 4107 | 40 |
a. Make a frequency table for the Chem 103 test scores.
b. Draw a bar graph for the data in Table 15-12.
a.
To find:
The frequency table for the Chem 103 test scores.
Answer to Problem 1E
Solution:
The frequency table for the Chem 103 test scores is given by,
| Score | Frequency |
| 10 | 1 |
| 40 | 1 |
| 50 | 3 |
| 60 | 7 |
| 70 | 6 |
| 80 | 5 |
| 100 | 2 |
Explanation of Solution
Given:
The table below shows the scores on a Chem 103 test consisting of 10 questions worth 10 points each.
| Student ID | Score | Student ID | Score |
| 1362 | 50 | 4315 | 70 |
| 1486 | 70 | 4719 | 70 |
| 1721 | 80 | 4951 | 60 |
| 1932 | 60 | 5321 | 60 |
| 2489 | 70 | 5872 | 100 |
| 2766 | 10 | 6433 | 50 |
| 2877 | 80 | 6921 | 50 |
| 2964 | 60 | 8317 | 70 |
| 3217 | 70 | 8854 | 100 |
| 3588 | 80 | 8964 | 80 |
| 3780 | 80 | 9158 | 60 |
| 3921 | 60 | 9347 | 60 |
| 4107 | 40 |
A frequency table is a table with the frequency of each actual value in the data set.
Approach:
From the given table the number of students with a score of 10 is 1, so the frequency of score 10 is 1, similarly the number of students with a score of 40 is 1, so the frequency of score 40 is 1 similarly frequencies for rest of scores can be computed.
The frequency table for the Chem 103 test is given by,
| Score | Frequency |
| 10 | 1 |
| 40 | 1 |
| 50 | 3 |
| 60 | 7 |
| 70 | 6 |
| 80 | 5 |
| 100 | 2 |
b)
To construct:
The bar graph corresponding to the given table.
Answer to Problem 1E
Solution:
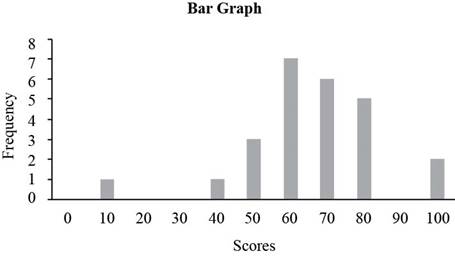
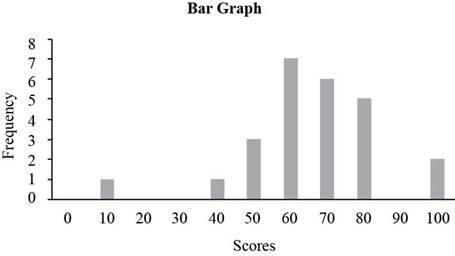
The bar graph is given below.

Explanation of Solution
Given:
The table below shows the scores on a Chem 103 test consisting of 10 questions worth 10 points each.
| Student ID | Score | Student ID | Score |
| 1362 | 50 | 4315 | 70 |
| 1486 | 70 | 4719 | 70 |
| 1721 | 80 | 4951 | 60 |
| 1932 | 60 | 5321 | 60 |
| 2489 | 70 | 5872 | 100 |
| 2766 | 10 | 6433 | 50 |
| 2877 | 80 | 6921 | 50 |
| 2964 | 60 | 8317 | 70 |
| 3217 | 70 | 8854 | 100 |
| 3588 | 80 | 8964 | 80 |
| 3780 | 80 | 9158 | 60 |
| 3921 | 60 | 9347 | 60 |
| 4107 | 40 |
A bar graph is a graph with bars (column) representing each of the actual values in the data set. The height of each column represents the frequency of the value in the data set.
Approach:
From the given table the number of students with a score of 0 is 0, so the frequency of score 0 is 0, similarly the number of students with a score of 10 is 1, so the frequency of score 10 is 1 similarly frequencies for rest of scores can be computed.
The frequency table for the Chem 103 test is given by,
| Score | Frequency |
| 0 | 0 |
| 10 | 1 |
| 20 | 0 |
| 30 | 0 |
| 40 | 1 |
| 50 | 3 |
| 60 | 7 |
| 70 | 6 |
| 80 | 5 |
| 90 | 0 |
| 100 | 2 |
Place the scores along horizontal axis and the frequencies along vertical axis to construct bar graph. The bar graph of the frequency table is given below.

Want to see more full solutions like this?
Chapter 15 Solutions
EXCURSIONS IN MOD.MATH W/ACCESS >BI<
Additional Math Textbook Solutions
Pathways To Math Literacy (looseleaf)
Finite Mathematics for Business, Economics, Life Sciences and Social Sciences
Introductory Statistics
Elementary & Intermediate Algebra
Algebra and Trigonometry (6th Edition)
Calculus: Early Transcendentals (2nd Edition)
- Select the polynomials below that can be solved using Completing the Square as written. 6m² +12m 8 = 0 Oh²-22x 7 x²+4x-10= 0 x² + 11x 11x 4 = 0arrow_forwardProve that the usual toplogy is firast countble or hot and second countble. ①let cofinte toplogy onx show that Sivast countble or hot and second firast. 3) let (x,d) be matricspace show that is first and second countble. 6 Show that Indiscret toplogy is firstand Second op countble or not.arrow_forwardH.W For any events A and B, show that 1. P(AB)s P(A)≤ P(AUB)≤ P(A) + P(B)arrow_forward
- a) Find the scalars p, q, r, s, k1, and k2. b) Is there a different linearly independent eigenvector associated to either k1 or k2? If yes,find it. If no, briefly explain.arrow_forwardPlz no chatgpt answer Plz Will upvotearrow_forward1/ Solve the following: 1 x + X + cos(3X) -75 -1 2 2 (5+1) e 5² + 5 + 1 3 L -1 1 5² (5²+1) 1 5(5-5)arrow_forward
 Holt Mcdougal Larson Pre-algebra: Student Edition...AlgebraISBN:9780547587776Author:HOLT MCDOUGALPublisher:HOLT MCDOUGAL
 Glencoe Algebra 1, Student Edition, 9780079039897...AlgebraISBN:9780079039897Author:CarterPublisher:McGraw Hill
 Functions and Change: A Modeling Approach to Coll...AlgebraISBN:9781337111348Author:Bruce Crauder, Benny Evans, Alan NoellPublisher:Cengage Learning
 Big Ideas Math A Bridge To Success Algebra 1: Stu...AlgebraISBN:9781680331141Author:HOUGHTON MIFFLIN HARCOURTPublisher:Houghton Mifflin Harcourt


