EXCURSIONS IN MOD.MATH W/ACCESS >BI<
9th Edition
ISBN: 9781323788721
Author: Tannenbaum
Publisher: PEARSON C
expand_more
expand_more
format_list_bulleted
Concept explainers
Videos
Textbook Question
Chapter 15, Problem 14E
Exercise 13 and 14 refer to the pie chart in Fig. 15-16.
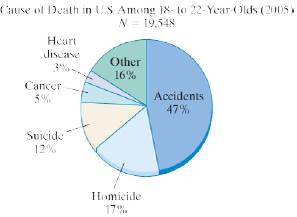
Figure 15-16
Source: Centers for Disease Control and Prevention, www.cdc.gov.
Use the data provided in the pie chart to estimate the number of 18- to 22-year-olds who died in the United States in 2005 for each category shown in the pie chart.
Expert Solution & Answer
Want to see the full answer?
Check out a sample textbook solution
Students have asked these similar questions
In a survey, the planning value for the population proportion is p 0.25. How large a sample should be taken to provide a 95% confidence interval with a margin of error
of 0.03? Round your answer up to the next whole number.
800
{
Q/ calculate the Fourier series of f(x) on the given
interval
f(x) = x Sin X
9
-
Q
2/
Calculate the Fourier series of f(x) on the given
interval
f(x) = x Sin X
- 16 x ≤
メ
Chapter 15 Solutions
EXCURSIONS IN MOD.MATH W/ACCESS >BI<
Ch. 15 - Exercises 1 through 4 refer to the data set shown...Ch. 15 - Exercises 1 through 4 refer to the data set shown...Ch. 15 - Exercises 1 through 4 refer to the data set shown...Ch. 15 - Exercises 1 through 4 refer to the data set shown...Ch. 15 - Exercises 5 through 10 refer to Table 15-13, which...Ch. 15 - Exercises 5 through 10 refer to Table 15-13, which...Ch. 15 - Exercises 5 through 10 refer to Table 15-13, which...Ch. 15 - Exercise 5 through 10 refer to Table 15-13, which...Ch. 15 - Exercise 5 through 10 refer to Table 15-13, which...Ch. 15 - Exercise 5 through 10 refer to Table 15-13, which...
Ch. 15 - Exercise 11 and 12 refer to the bar graph shown in...Ch. 15 - Exercise 11 and 12 refer to the bar graph shown in...Ch. 15 - Exercise 13 and 14 refer to the pie chart in Fig....Ch. 15 - Exercise 13 and 14 refer to the pie chart in Fig....Ch. 15 - Table 15-14 shows the class interval frequencies...Ch. 15 - Table 15-15 shows the class interval frequencies...Ch. 15 - Table 15-16 shows the percentage of U.S. working...Ch. 15 - Table 15-17 shows the percentage of U.S. workers...Ch. 15 - Exercises 19 and 20 refer to Table 15-18, which...Ch. 15 - More than Less than or equal to Number of babies...Ch. 15 - Exercises 21 and 22 refer to the two histograms...Ch. 15 - Exercises 21 and 22 refer to the two histograms...Ch. 15 - Consider the data set {3,5,7,4,8,2,8,3,6}. a.Find...Ch. 15 - Consider the data set {4,6,8,5.2,10.4,10,12.6,13}...Ch. 15 - Find the average A and median M of each of the...Ch. 15 - Find the average A and median M of each of the...Ch. 15 - Find the average A and median M of each of the...Ch. 15 - Find the average A and median M of each of the...Ch. 15 - Table 15-19 shows the results of a 5-point musical...Ch. 15 - Table 15-20 shows the ages of the firefighters in...Ch. 15 - Table 15-21 shows the relative frequencies of the...Ch. 15 - Table 15-22 shows the relative frequencies of the...Ch. 15 - Consider the data set {5,7,4,8,2,8,3,6}. a. Find...Ch. 15 - Consider the data set {4,6,8,5.2,10.4,10,12.6,13}....Ch. 15 - For each data set, find the 75th and the 90th...Ch. 15 - For each data set, find the 10th and the 25th...Ch. 15 - Table 15-20 Age 25 27 28 29 30 Frequency 2 7 6 9...Ch. 15 - This exercise refers to the math quiz scores shown...Ch. 15 - Prob. 39ECh. 15 - Exercise 39 and 40 refer to SAT test scores for...Ch. 15 - Consider the data set {5,7,4,8,2,8,3,6}. a. Find...Ch. 15 - Consider the data set {4,6,8,5.2,10.4,10,12.6,13}....Ch. 15 - Prob. 43ECh. 15 - This exercise refers to the distribution of the...Ch. 15 - Exercises 45 and 46 refer to the two box plots in...Ch. 15 - Exercises 45 and 46 refer to the two box plots in...Ch. 15 - For the data set {5,7,4,8,2,8,3,6}, find a. the...Ch. 15 - For the data set {4,6,8,5.2,10.4,10,12.6,13}, find...Ch. 15 - A realty company has sold N=341 homes in the last...Ch. 15 - Exercise 45 and 46 refer to the box plot in...Ch. 15 - Prob. 51ECh. 15 - For Exercises 51 through 54, you should use the...Ch. 15 - For Exercises 51 through 54, you should use the...Ch. 15 - For Exercises 51 through 54, you should use the...Ch. 15 - The purpose of Exercises 55 and 56 is to practice...Ch. 15 - The purpose of Exercises 55 and 56 is to practice...Ch. 15 - Exercises 57 and 58 refer to the mode of a data...Ch. 15 - Exercises 57 and 58 refer to the mode of a data...Ch. 15 - Mikes average on the first five exams in Econ 1A...Ch. 15 - Explain each of the following statements regarding...Ch. 15 - In 2006, the median SAT score was the average of...Ch. 15 - In 2004, the third quartile SAT scores was...Ch. 15 - Prob. 63ECh. 15 - Suppose that the average of 10 numbers is 7.5 and...Ch. 15 - Prob. 65ECh. 15 - What happens to the five-number summary of the...Ch. 15 - Prob. 67ECh. 15 - Prob. 68ECh. 15 - Prob. 69ECh. 15 - Prob. 70ECh. 15 - Prob. 71ECh. 15 - Prob. 72ECh. 15 - Prob. 73ECh. 15 - Suppose that the standard deviation of the data...Ch. 15 - Chebyshevs theorem. The Russian mathematician P.L....
Knowledge Booster


Learn more about
Need a deep-dive on the concept behind this application? Look no further. Learn more about this topic, subject and related others by exploring similar questions and additional content below.Similar questions
- H.w WI M Wz A Sindax Sind dy max Утах at 0.75m from A w=6KN/M L=2 W2=9 KN/m P= 10 KN B Make the solution handwritten and not artificial intelligence because I will give a bad rating if you solve it with artificial intelligencearrow_forward2. A microwave manufacturing firm has determined that their profit function is P(x)=-0.0014x+0.3x²+6x-355 , where is the number of microwaves sold annually. a. Graph the profit function using a calculator. b. Determine a reasonable viewing window for the function. c. Approximate all of the zeros of the function using the CALC menu of your calculator. d. What must be the range of microwaves sold in order for the firm to profit?arrow_forwardSolve by DrWz WI P L B dy Sind Ⓡ de max ⑦Ymax dx Solve by Dr ③Yat 0.75m from A w=6KN/M L=2 W2=9 kN/m P= 10 KN Solve By Drarrow_forward
- A clothing manufacturer's profitability can be modeled by p (x)=-x4 + 40x² - 144, where .x is the number of items sold in thousands and p (x) is the company's profit in thousands of dollars. a. Sketch the function on your calculator and describe the end behavior. b. Determine the zeros of the function. c. Between what two values should the company sell in order to be profitable? d. Explain why only two of the zeros are considered in part c.arrow_forwardCCSS REASONING The number of subscribers using pagers in the United States can be modeled by f(x) = 0.015x4 -0.44x³ +3.46x² - 2.7x+9.68 where x is the number of years after 1990 and f(x) is the number of subscribers in millions. a. Graph the function. b. Describe the end behavior of the graph. c. What does the end behavior suggest about the number of pager subscribers? d. Will this trend continue indefinitely? Explain your reasoning.arrow_forwardHow to find the radius of convergence for the series in the image below? I'm stuck on how to isolate the x in the interval of convergence.arrow_forward
- djdjjdjdk4jr i need help on part C,arrow_forwardDetermine the exact signed area between the curve g(x): x-axis on the interval [0,1]. = tan2/5 secx dx andarrow_forwardSet up the partial fraction expansion of the function below. Do not explicitly solve for the variables 5 x²(x − 2)(x − 3)³ (24 - 81)² -arrow_forward
- Evaluate the integral below: (4w (4w8) sec(4w) tan(4w) dwarrow_forwardEvaluate the integral 7 x²√22-16 dxarrow_forwardQuestion 2. An American option on a stock has payoff given by F = f(St) when it is exercised at time t. We know that the function f is convex. A person claims that because of convexity, it is optimal to exercise at expiration T. Do you agree with them?arrow_forward
arrow_back_ios
SEE MORE QUESTIONS
arrow_forward_ios
Recommended textbooks for you
 Glencoe Algebra 1, Student Edition, 9780079039897...AlgebraISBN:9780079039897Author:CarterPublisher:McGraw Hill
 Holt Mcdougal Larson Pre-algebra: Student Edition...AlgebraISBN:9780547587776Author:HOLT MCDOUGALPublisher:HOLT MCDOUGAL
 Big Ideas Math A Bridge To Success Algebra 1: Stu...AlgebraISBN:9781680331141Author:HOUGHTON MIFFLIN HARCOURTPublisher:Houghton Mifflin Harcourt
Glencoe Algebra 1, Student Edition, 9780079039897...
Algebra
ISBN:9780079039897
Author:Carter
Publisher:McGraw Hill
Holt Mcdougal Larson Pre-algebra: Student Edition...
Algebra
ISBN:9780547587776
Author:HOLT MCDOUGAL
Publisher:HOLT MCDOUGAL
Big Ideas Math A Bridge To Success Algebra 1: Stu...
Algebra
ISBN:9781680331141
Author:HOUGHTON MIFFLIN HARCOURT
Publisher:Houghton Mifflin Harcourt
Which is the best chart: Selecting among 14 types of charts Part II; Author: 365 Data Science;https://www.youtube.com/watch?v=qGaIB-bRn-A;License: Standard YouTube License, CC-BY