Concept explainers
Find the reaction and plot the shear and bending moment diagram.
Answer to Problem 15P
The end moments at the member A
Explanation of Solution
Fixed end moment:
Formula to calculate the fixed moment for point load with equal length are
Formula to calculate the fixed moment for point load with unequal length are
Formula to calculate the fixed moment for UDL is
Formula to calculate the fixed moment for deflection is
Calculation:
Consider the flexural rigidity EI of the beam is constant.
Show the free body diagram of the entire beam as in Figure 1.
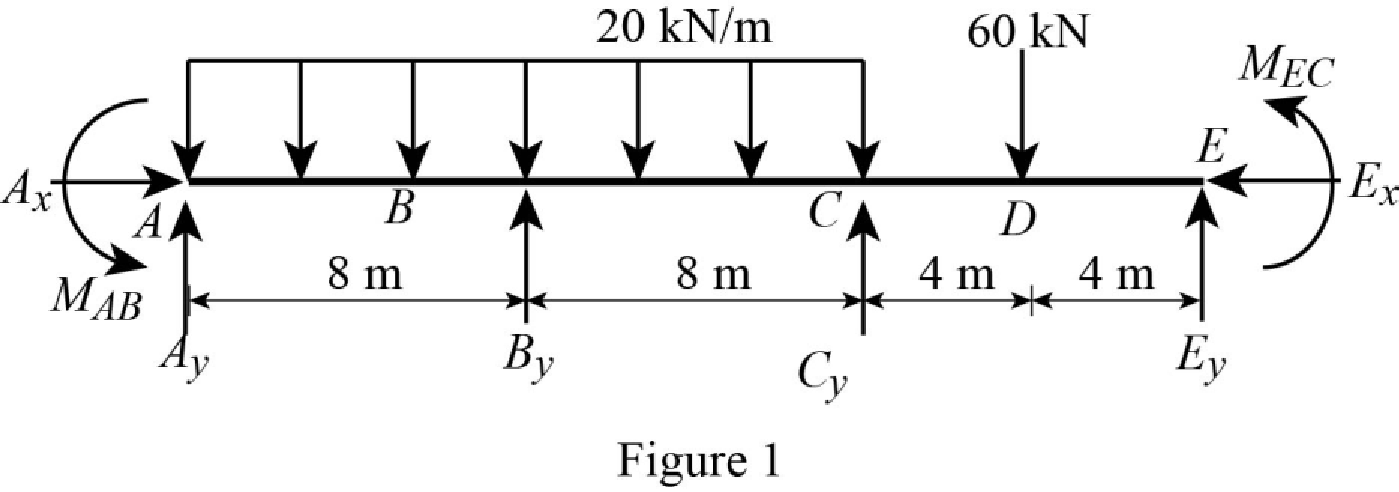
Refer Figure 1,
Calculate the fixed end moment for AB.
Calculate the fixed end moment for BA.
Calculate the fixed end moment for BC.
Calculate the fixed end moment for CB.
Calculate the fixed end moment for CE.
Calculate the fixed end moment for EC.
Chord rotations:
Show the free body diagram of the chord rotation of the beam as in Figure 2.
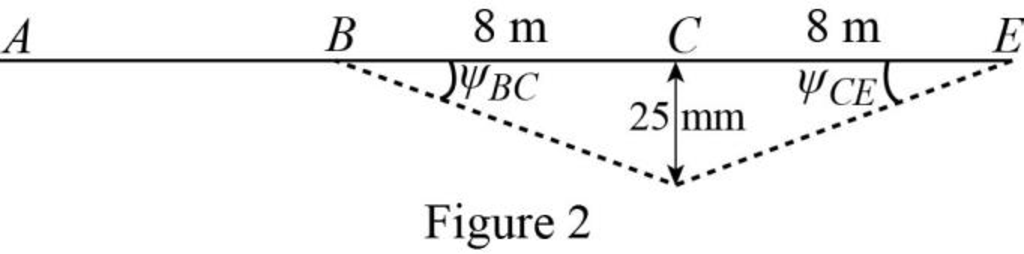
Calculate the chord rotation of the beam BC.
Calculate the chord rotation of the beam CE.
Calculate the slope deflection equation for the member AB.
Here,
Substitute
Calculate the slope deflection equation for the member BA.
Substitute
Calculate the slope deflection equation for the member BC.
Substitute
Calculate the slope deflection equation for the member CB.
Substitute
Calculate the slope deflection equation for the member CE.
Substitute
Calculate the slope deflection equation for the member EC.
Substitute
Write the equilibrium equation as below.
Substitute equation (2) and equation (3) in above equation.
Write the equilibrium equation as below.
Substitute equation (4) and equation (5) in above equation.
Solve the equation (7) and equation (8).
Calculate the moment about AB.
Substitute
Calculate the moment about BA.
Substitute
Calculate the moment about BC.
Substitute
Calculate the moment about CB.
Substitute
Calculate the moment about CE.
Substitute
Calculate the moment about EC.
Substitute
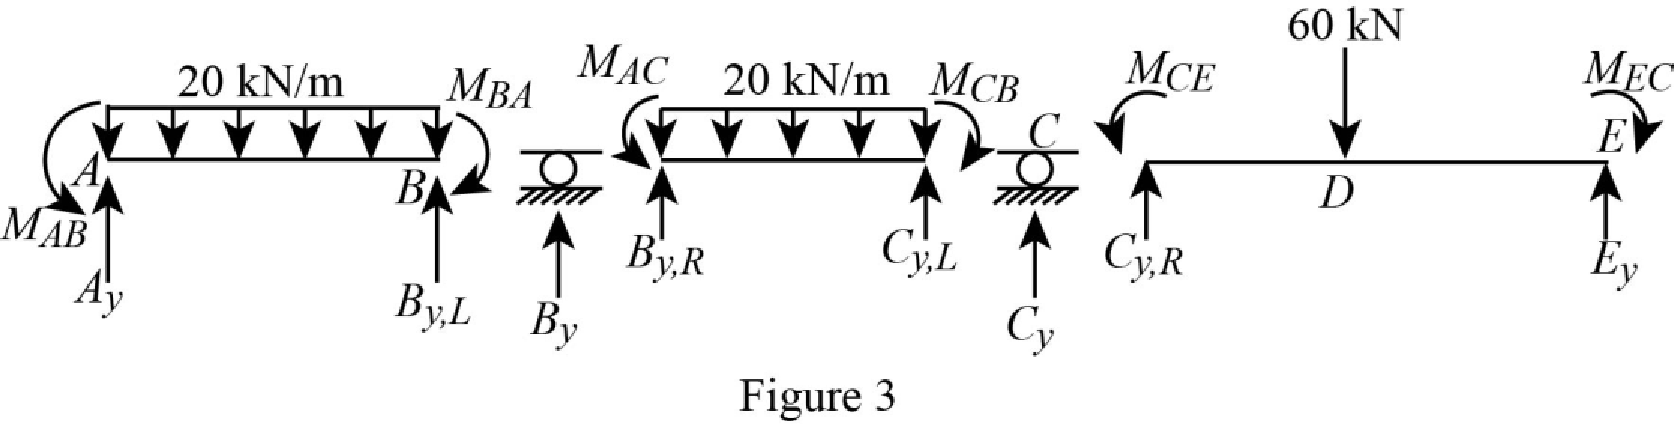
Consider the member AB of the beam:
Show the section free body diagram of the member AB, BC and CE as in Figure 3.
Calculate the vertical reaction at the left end of the joint B by taking moment about point A.
Calculate the horizontal reaction at point A by resolving the horizontal equilibrium.
Calculate the vertical reaction at point A by resolving the vertical equilibrium.
Consider the member BC of the beam:
Calculate the vertical reaction at the right end of the joint B by taking moment about point C.
Calculate the vertical reaction at the left end of joint C by resolving the vertical equilibrium.
Calculate the total reaction at point B.
Substitute
Calculate the vertical reaction at the right end of the joint C by taking moment about point E.
Calculate the horizontal reaction at point E by resolving the horizontal equilibrium.
Calculate the vertical reaction at point E by resolving the vertical equilibrium.
Calculate the total reaction at point C.
Substitute
Show the reactions of the beam in Figure 4.
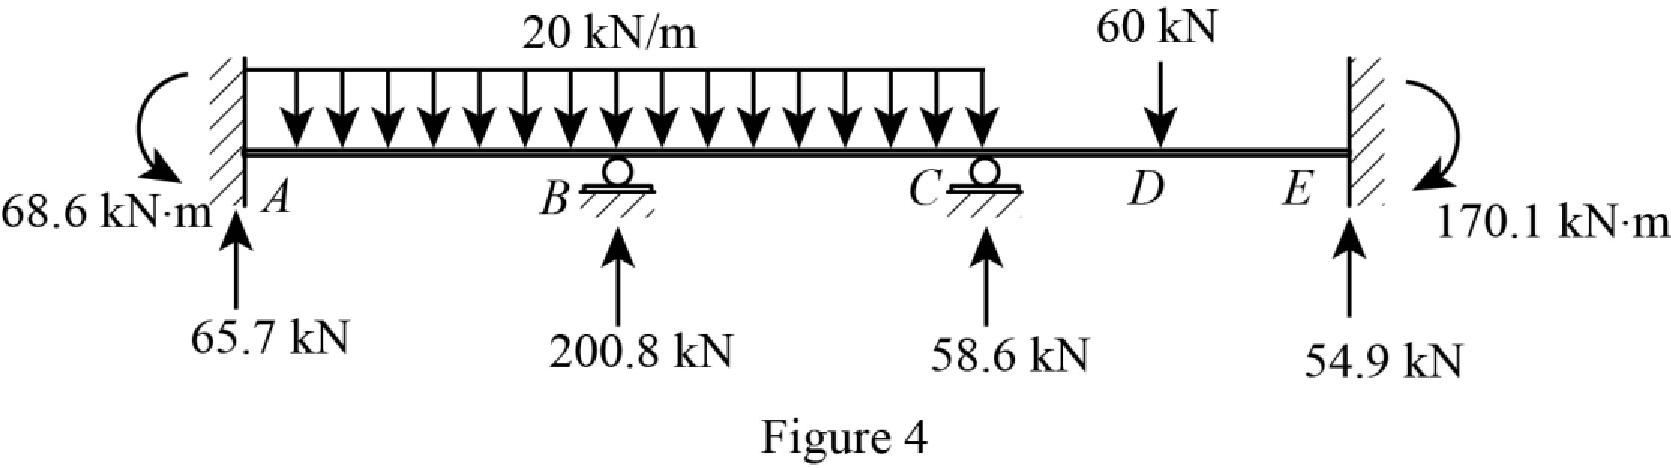
Refer Figure 4,
Shear diagram:
Point A:
Point B:
Point C:
Point E:
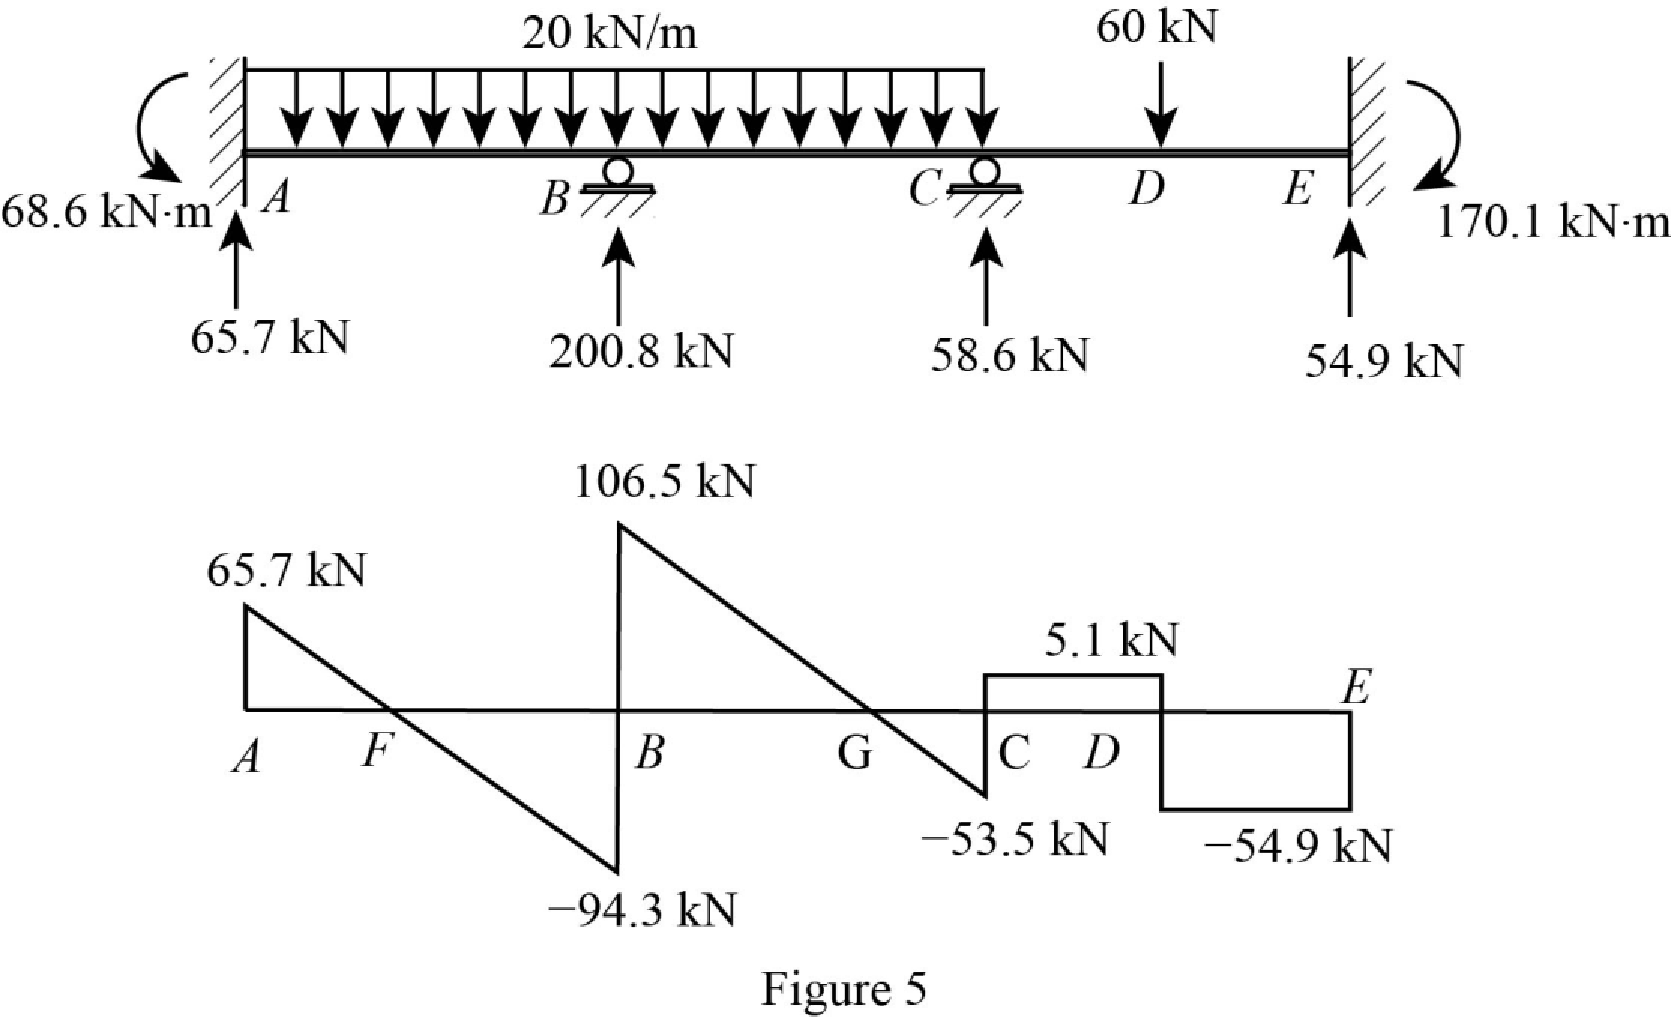
Plot the shear force diagram of the beam as in Figure 5.
Show the shear diagram of the section AB as in Figure 6.
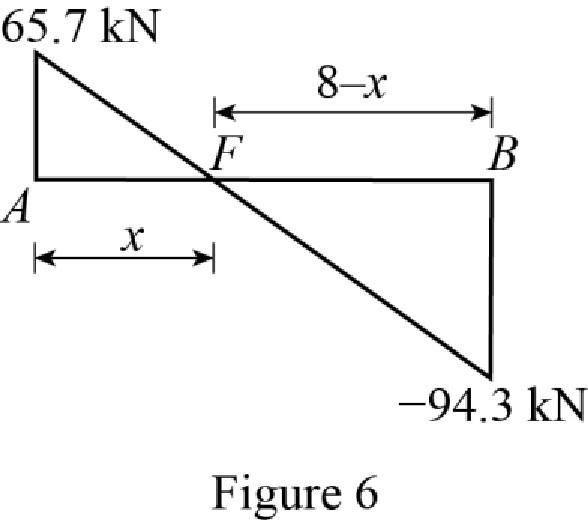
Use the similar triangle concept, to find the location of the maximum bending moment.
Show the shear diagram of the section BC as in Figure 7.
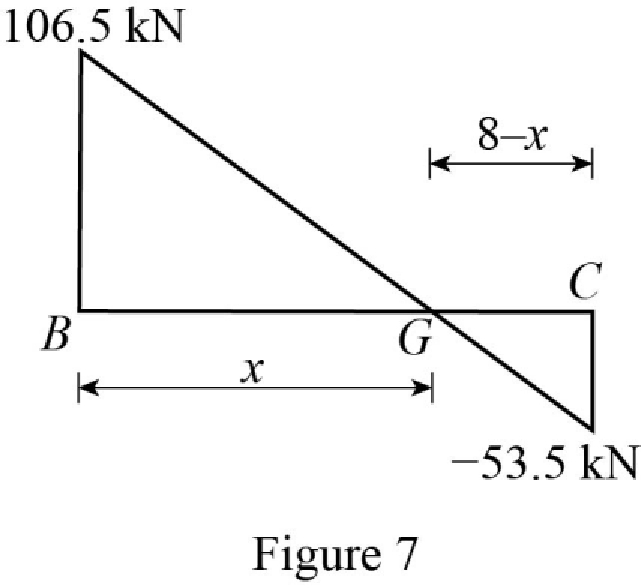
Use the similar triangle concept, to find the location of the maximum bending moment.
Refer Figure 4,
Bending moment diagram:
Point A:
Point F:
Point B:
Point G:
Point C:
Point D:
Point E:
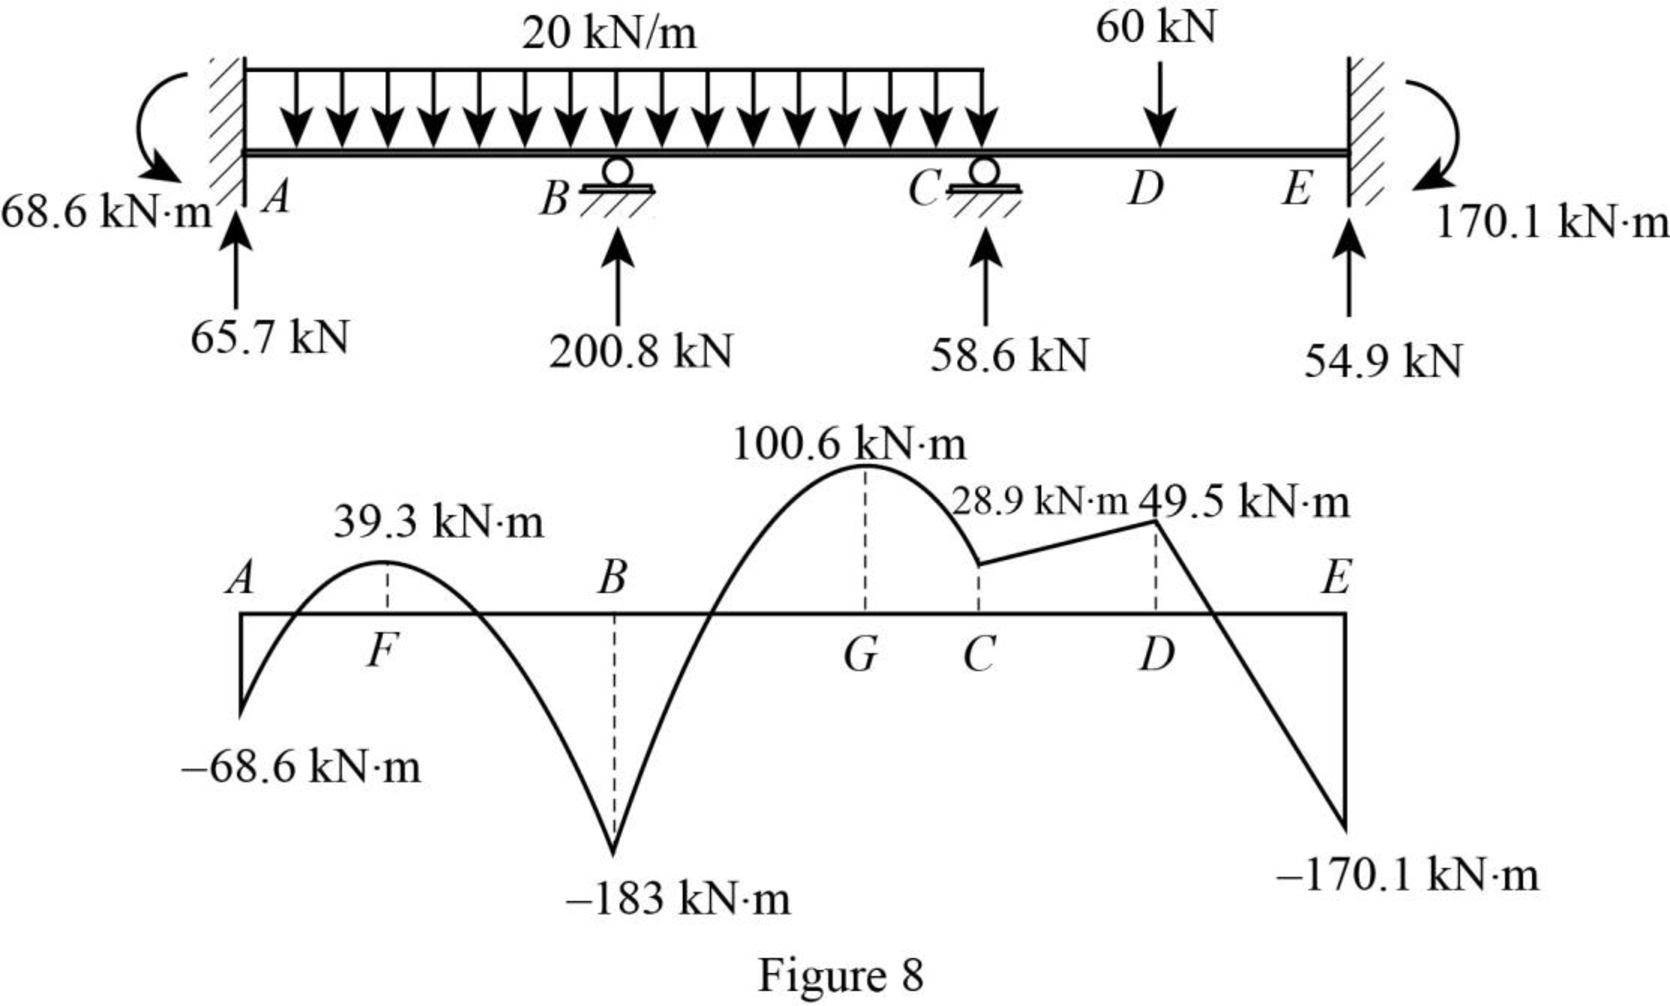
Plot the bending moment diagram of the beam as in Figure 8.
Want to see more full solutions like this?
Chapter 15 Solutions
Structural Analysis (MindTap Course List)


- a. Draw trajectories of approximately 8 to 11 vehicles moving on a one way 1-lane road with different time-varying speeds. b. Consider a time-space window in the time-space diagram of part (a). See below. Denote the number of vehicles passing BD, DC, AC, and AB respectively as n1, N2, N3, and n4. Write an equation relating n₁, N2, N3, and n4 to each other. What is the physical intuition of this equation? Please elaborate. X 4 X. n4 n3 с n2 X1 D B n1 t c. Using density (k) definition at time instances t₁ and t₂ and flow (q) definition at locations X1 and X2, rewrite equation of interest in part (b) to demonstrate KAB-KCD 9BD-9AC + t₂-t1 x2-x1 = 0. d. What will be the equation in part (c), in case of x2 → x1 and t₂ → t₁.arrow_forwardConsider a city center where the traffic conditions are described by a Macroscopic Fundamental Diagram (MFD) of network outflow (g- rate of trips finished) vs. accumulation (n- number of cars) with a trapezoidal shape, as shown in the figure below. The values of the parameters are: • • maximum trip completion rate gmax=100 [veh/min] critical accumulations ncr1=1000 [veh] and ncr2=1500 [veh] jam accumulation njam=4000 [veh]. gmax ncr1 ncr2 njam There are two types of demands in the morning peak hour (7-8am): trips generated from outside the city center with rate q1=80 [veh/min], and trips generated from within the city center with rate q2=50 [veh/min]. In addition, a perimeter traffic control, u, is available that only restricts vehicles entering the city from outside. If at 7am there are already no=500 [veh] in the city center: a. Write the dynamic equations (mass conservation equation) in a continuous form for the center of the city. b. Convert the continuous dynamic into the discrete…arrow_forwardAssume a car park facility where the arrival rate is 1 customer every minute, and the service process including pressing the button, taking the card, and waiting for the boom to rise leads to service rate of μ customer every minute. a. Assume the arrival and service processes are stochastic. Using any software (Excel, Matlab, or the one you prefer), plot average delay time (including service time) and average queue size (including the vehicle currently being served) for all combinations of λ = {1,2,3,..,10} and p = {0.1,0.3,0.5,0.7,0.9}. Specifically, we ask you to make 2 graphs (one for average delay and the other for average queue size), where the x-axes contains the different values for 1, and where you make one curve for each p. b. Assume the arrival process is stochastic but the service process is deterministic with rate μ. Using any software (Excel, Matlab, or the one you prefer), plot average delay time (including service time) and average queue size (including the vehicle…arrow_forward
- A traffic signal has a 60-second cycle length (Red time + Green time). For the travel direction of interest, the red and green times are 30 seconds each, the arrival rate is constant at 20 [veh/min] and the saturation flow (i.e., the departure rate) is 1 [veh/sec]. a. Calculate the average delay (for all vehicles) for the travel direction of interest. b. Assume a work zone on the street downstream of the intersection so that only 25 [veh/min] (in the direction of interest) can pass. Calculate the average delay caused by the work zone to a vehicle leaving the intersection. Assume that the queue at the work zone never backs- up into the intersection. c. Discuss qualitatively the implications of queue spillback from the work zone on the delay of the system. Traffic Direction (a) Traffic Direction (b)arrow_forwardAttached pics is a sample problem, can you compute it for me, I just want to compare my answer. Thank you.arrow_forwardProblem 2: The Douglas fir beam below supports uniform live (WL) and dead loads (WD) as shown below. Assume the total distributed load is 700 lb/ft. WD=300#/PT. W₁ = 400# W₁ = 400#/FT- J J J J I J J J L=161 a) Assuming an alllowable deflection of L/360, compute the magnitude of the allowable deflection. b) Using an 8"x12" timber beam (see Table A1-b on page 567 of your text for properties) compute the actual deflection. Assume E = 1.6 x 100 psi. c) Based on your answers for parts a and b, determine if an 8"x12" timber beam is safe for this applicationarrow_forward
- Please use relationship method as I do not understand that one.arrow_forwardA freeway study resulted in a speed-density relationship: v=60(1-0.008k). Determine: a. The free-flow speed. b. The jam density. c. The speed-flow relationship. d. The flow-density relationship. e. The critical density. f. The capacity.arrow_forwardAverage Shear Stress BASIC FORMULAS General Shear Stress fv lb Shear Flow Flexural or Bending Stress VQ q Fb Mc M 1 Sx dtw fy-shear stress V = shear capacity d depth of the section tw = web thickness Radius of Gyration Q-statical moment of area Imoment of inertia of whole section b value of width where you cut Note: can be used to solve maximum shear stress Note: Maximum Shear Stress is located at the neutral axis (smallest width) Section Modulus Sx=x NOTE: If not given Fy 248 MPa for A36 Steel Fu-400 MPa for A36 Steel Es-200,000 MPa fb flexural or bending stress M-moment capacity I-Moment of Inertia of the whole section Sx-section modulus fy actual shear stress (from loads) Fv allowable shear stress (from NSCP) fv-Fv; safe and economical Vmax= P2 P Mmax = COMMON LOADINGS AND SUPPORTS PPP L/4 4↓1 44 L/4 PL PL Ymax = 48E1 Vmax = 1.5P Mmax = 22 PL 19PL Ymax = 384E1 P P [[ P P WL Vmax= 2 Mmax = P P L/3 ↓ L/3 ↓ L/3 WL' Swi Ymax = 384 ΕΙ PL 23PL Vmax = P Mmax = 이 Ymax =. 648E1arrow_forward
- Consider, M people (aka pax) who want to travel by car from O to D. They all start working at D at Q (e.g., Q-8am). If a person departs at time t, assume the time needed to go from O to D is given by c(t)=A+Bx(t), where x(t) is the flow of people departing at time t [car/unit of time]. In addition, a is the penalty for being early at work (E(t) is how early the person arrived when departing at time t), and ẞ is the penalty for being late at work (L(t) is how late the person arrived when departing at time t). Assume 0 < a < 1 < ß. Further assume the departure time choice problem under the equilibrium conditions. Prove that the arrival time of people who depart when most of the M people start their trips is equal to Q.arrow_forwardConstruction Methodarrow_forwardConstruction Method Ps. not graded, just a reviewerarrow_forward
