
Concept explainers
Videos
(a)
Interpretation:
The IR spectrum of the given compound is to be sketched with the X-axis range from
Concept introduction:
IR spectroscopy enables to identify different
One of the greatest advantages of IR spectroscopy is that the frequency of a particular type of vibration is typically found within a characteristic range of frequencies, regardless of the functional group with which the vibration is associated. The fact that absorptions by certain vibrations appear with characteristic frequency ranges enables us to use IR spectroscopy to obtain structural information about a molecule. Stretching vibrations of
Answer to Problem 15.56P
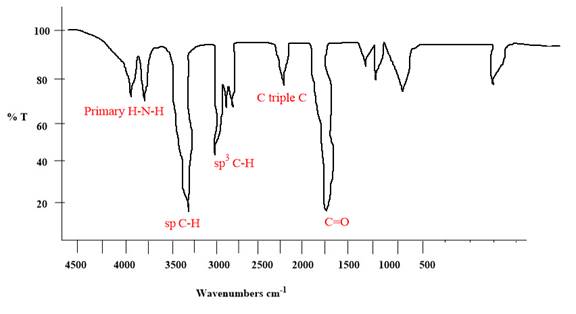
The IR spectrum of the given molecule can be sketched as follows:

Explanation of Solution
The given molecule is
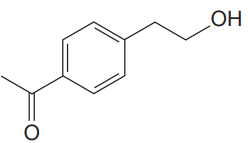
The given molecule has a ketone and alcohol as functional groups. According to Table 15-2, the characteristic frequency of absorption of alcohols
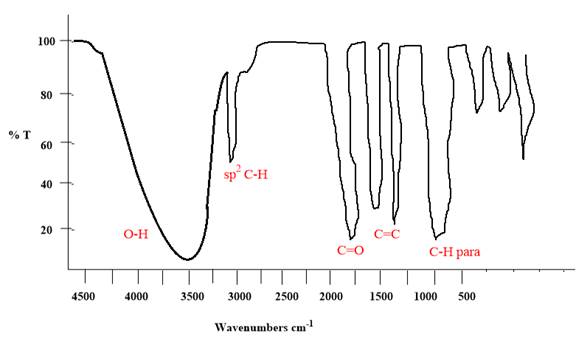
Each significant peak is assigned in the above IR spectrum.
The absorptions by certain vibrations appear with characteristic frequency ranges, enabling us to use IR spectroscopy to obtain structural information about a molecule.
(b)
Interpretation:
The IR spectrum of the given compound is to be sketched with the X-axis range from
Concept introduction:
IR spectroscopy enables to identify different functional groups in the given molecule.
One of the greatest advantages of IR spectroscopy is that the frequency of a particular type of vibration is typically found within a characteristic range of frequencies, regardless of the functional group with which the vibration is associated. The fact that absorptions by certain vibrations appear with characteristic frequency ranges enables us to use IR spectroscopy to obtain structural information about a molecule. Stretching vibrations of
Answer to Problem 15.56P
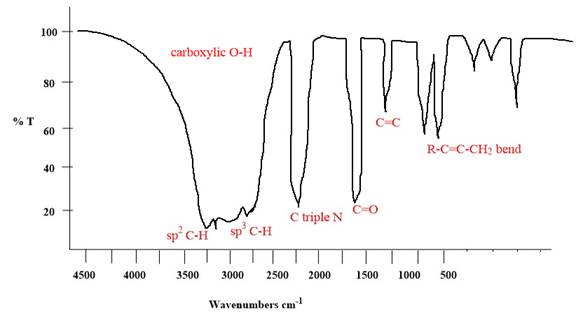
The IR spectrum of the given molecule can be sketched as follows:

Explanation of Solution
The given molecule is
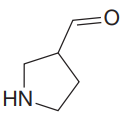
The given molecule has an
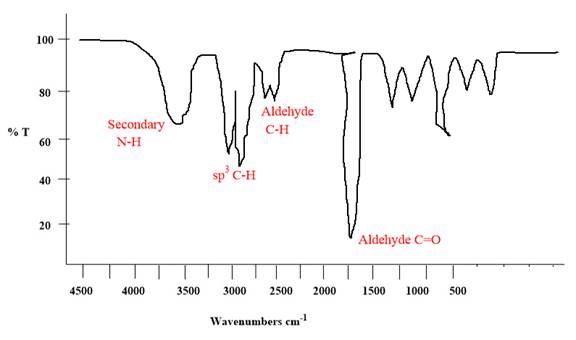
Each significant peak is assigned in the above IR spectrum.
The absorptions by certain vibrations appear with characteristic frequency ranges, enabling us to use IR spectroscopy to obtain structural information about a molecule.
(c)
Interpretation:
The IR spectrum of the given compound is to be sketched with the X-axis range from
Concept introduction:
IR spectroscopy enables to identify different functional groups in the given molecule.
One of the greatest advantages of IR spectroscopy is that the frequency of a particular type of vibration is typically found within a characteristic range of frequencies, regardless of the functional group with which the vibration is associated. The fact that absorptions by certain vibrations appear with characteristic frequency ranges enables us to use IR spectroscopy to obtain structural information about a molecule. Stretching vibrations of
Answer to Problem 15.56P
The IR spectrum of the given molecule can be sketched as follows:
Explanation of Solution
The given molecule is
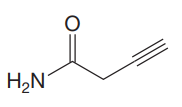
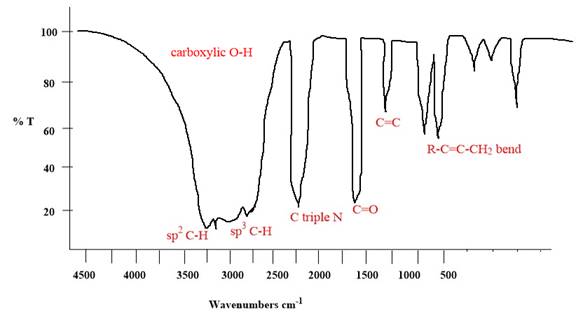
The given molecule has an alkyne and a primary amide as functional groups. According to Table 15-2, the characteristic frequency of absorption of amides
Each significant peak is assigned in the above IR spectrum.
The absorptions by certain vibrations appear with characteristic frequency ranges, enabling us to use IR spectroscopy to obtain structural information about a molecule.
(d)
Interpretation:
The IR spectrum of the given compound is to be sketched with the X-axis range from
Concept introduction:
IR spectroscopy enables to identify different functional groups in the given molecule.
One of the greatest advantages of IR spectroscopy is that the frequency of a particular type of vibration is typically found within a characteristic range of frequencies, regardless of the functional group with which the vibration is associated. The fact that absorptions by certain vibrations appear with characteristic frequency ranges enables us to use IR spectroscopy to obtain structural information about a molecule. Stretching vibrations of
Answer to Problem 15.56P
The IR spectrum of the given molecule can be sketched as follows:
Explanation of Solution
The given molecule is
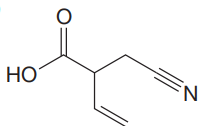
The given molecule has
According to Table 15-2, the characteristic frequency of absorption of
Each significant peak is assigned in the above IR spectrum.
The absorptions by certain vibrations appear with characteristic frequency ranges, enabling us to use IR spectroscopy to obtain structural information about a molecule.
Want to see more full solutions like this?
Chapter 15 Solutions
Organic Chemistry: Principles And Mechanisms: Study Guide/solutions Manual (second)


- 5) Confidence interval. Berglund and Wichardt investigated the quantitative determination of Cr in high-alloy steels using a potentiometric titration of Cr(VI). Before the titration, samples of the steel were dissolved in acid and the chromium oxidized to Cr(VI) using peroxydisulfate. Shown here are the results (as %w/w Cr) for the analysis of a reference steel. 16.968, 16.922, 16.840, 16.883, 16.887, 16.977, 16.857, 16.728 Calculate the mean, the standard deviation, and the 95% confidence interval about the mean. What does this confidence interval mean?arrow_forwardIn the Nitrous Acid Test for Amines, what is the observable result for primary amines? Group of answer choices nitrogen gas bubbles form a soluble nitrite salt yellow oily layer of nitrosoaminearrow_forward3. a. Use the MS to propose at least two possible molecular formulas. For an unknown compound: 101. 27.0 29.0 41.0 50.0 52.0 55.0 57.0 100 57.5 58.0 58.5 62.0 63.0 64.0 65.0 74.0 40 75.0 76.0 20 20 40 60 80 100 120 140 160 180 200 220 m/z 99.5 68564810898409581251883040 115.0 116.0 77404799 17417M 117.0 12.9 118.0 33.5 119.0 36 133 0 1.2 157.0 2.1 159.0 16 169.0 219 170.0 17 171.0 21.6 172.0 17 181.0 1.3 183.0 197.0 100.0 198.0 200. 784 Relative Intensity 2 2 8 ō (ppm) 6 2arrow_forward
- Solve the structure and assign each of the following spectra (IR and C-NMR)arrow_forward1. For an unknown compound with a molecular formula of C8H100: a. What is the DU? (show your work) b. Solve the structure and assign each of the following spectra. 8 6 2 ō (ppm) 4 2 0 200 150 100 50 ō (ppm) LOD D 4000 3000 2000 1500 1000 500 HAVENUMBERI -11arrow_forward16. The proton NMR spectral information shown in this problem is for a compound with formula CioH,N. Expansions are shown for the region from 8.7 to 7.0 ppm. The normal carbon-13 spec- tral results, including DEPT-135 and DEPT-90 results, are tabulated: 7 J Normal Carbon DEPT-135 DEPT-90 19 ppm Positive No peak 122 Positive Positive cus и 124 Positive Positive 126 Positive Positive 128 No peak No peak 4° 129 Positive Positive 130 Positive Positive (144 No peak No peak 148 No peak No peak 150 Positive Positive してしarrow_forward
- 3. Propose a synthesis for the following transformation. Do not draw an arrow-pushing mechanism below, but make sure to draw the product of each proposed step (3 points). + En CN CNarrow_forwardShow work..don't give Ai generated solution...arrow_forwardLabel the spectrum with spectroscopyarrow_forward
 Organic Chemistry: A Guided InquiryChemistryISBN:9780618974122Author:Andrei StraumanisPublisher:Cengage Learning