
(a)
Interpretation:
The chemistry of the analytical method should be explained.
Concept introduction:
Quenching is the process of nonradiative energy transfer from an excited species to another molecule. This requires a contact between the excited species and a quenching agent. The rate of quenching is higher when the quencher concentration is high, because of higher number of collisions during the lifetime of the excited state.
Answer to Problem 15.16QAP
Al-acid alizarin garnet R acts as a quencher. The decrease in fluorescence is due to absorbing emission energy from F- by Al-acid alizarin garnet R complex.
Explanation of Solution
In this experiment standard addition technique has been used. Four water samples with same volume are taken and they have been spiked with standard F-. Different volumes of standard F- solution are added to the water samples prepared. Then excess, but same volumes of Al-acid alizarin garnet R are added to the four solutions. This Al-acid alizarin garnet R acts as a quencher. The complex absorbs emission energy from F-. So, instead of producing fluorescence from emission energy, it is quenched by the complex. So, the fluorescence intensity decreases.
(b)
Interpretation:
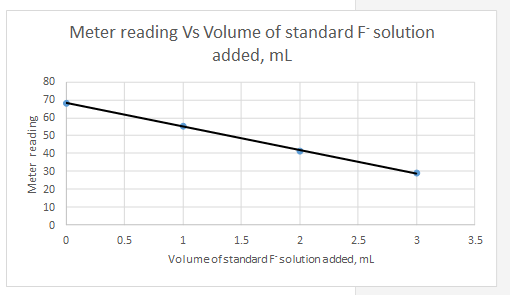
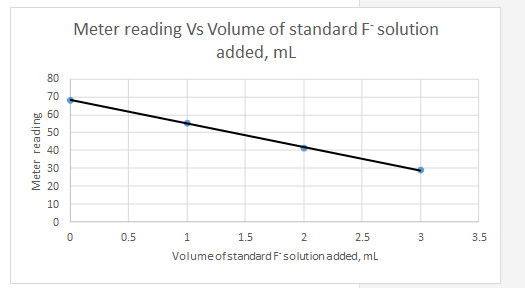
A plot of data should be constructed.
Concept introduction:
Standard addition method is used to analyze complex samples which matrix effect is significant. One common approach is standard addition technique is spiking of sample. In this method, one or more increments of a standard solution is added to the several aliquots of sample containing same volume. Each solution is then diluted to a fixed volume and experiment is proceeded.
Answer to Problem 15.16QAP
Explanation of Solution
Meter reading is the dependent variable and the volume of standard added is the independent variable.
(c)
Interpretation:
A relationship for multiple standard additions should be derived. An equation for the unknown concentration should be obtained in terms of the slope and the intercept of the standard addition plot.
Concept introduction:
Several aliquots with volume Vx of an unknown solution which have a concentration Cx are measured into volumetric flasks with volume Vt and then a standard solution with concentration Csis added in variable volumes of Vs. Then other reagents that aid for the detection are added and each volumetric flask is topped up to the maximum volume. Then instrumental measurements are made on each solution. If the instrumental response is proportional to the concentration of analyte, following equation can be derived.
k is a proportionality constant. According to above equation the instrumental signal versus Vs is a plot in the form of
Concentration of unknown then can be obtained by following equation.
Answer to Problem 15.16QAP
Explanation of Solution
The fluorescence decreases with the increasing amounts of F- standard. The control sample has the highest fluorescence meter reading. So the equation 1 can be rewrite as
The meter reading versus the volume of standard added has a linear relationship. Above equation can be written in the form of
An equation for the concentration of unknown can be derived by taking the ratio of intercept and the slope of fluorescence Vs Vs graph.
(d)
Interpretation:
The equation for the line representing the decrease in fluorescence relative to volume of standard should be determined.
Concept introduction:
In the least squares method, in order to find the slope and the intercept the three quantities Syy, Sxx and Sxy should be determined.
The slope of the line,
The intercept,
Answer to Problem 15.16QAP
Explanation of Solution
The three quantities Syy, Sxx and Sxy can be easily calculated using a spreadsheet and then the slope and the intercept can be calculated using the given equations.
| Vs, mL | Meter reading | |||||
| 0 | 68.2 | -1.5 | 19.8 | 392.04 | 2.25 | -29.7 |
| 1 | 55.3 | -0.5 | 6.9 | 47.61 | 0.25 | -3.45 |
| 2 | 41.3 | 0.5 | -7.1 | 50.41 | 0.25 | -3.55 |
| 3 | 28.8 | 1.5 | -19.6 | 384.16 | 2.25 | -29.4 |
| Sum | 874.22 | 5 | -66.1 | |||
| 48.4 | ||||||
| 1.5 |
So the equation for the line for the standard addition plot is
(e)
Interpretation:
The standard deviation of the slope and the intercept should be determined.
Concept introduction:
Standard deviation about regression,
N − number of points used.
The standard deviation of the slope,
The standard deviation of the intercept,
Answer to Problem 15.16QAP
Standard deviation of the slope = 0.194
Standard deviation of the intercept = 0.837
Explanation of Solution
in order to calculate the standard deviation of the slope or intercept, first standard deviation about regression should be determined.
Standard deviation of the slope,
Standard deviation of the intercept,
(f)
Interpretation:
The concentration of F- in the sample in parts per billion should be determine.
Concept introduction:
Cx − concentration of the unknown solution
Cs − concentration of standard solution
Vx − volume of unknown solution
m − slope of the instrumental signal versus volume of standard added curve
b − intercept of the instrumental signal versus volume of standard added curve
Answer to Problem 15.16QAP
Explanation of Solution
Intercept = 68.23
Slope = -13.22
Concentration of standard = 10.0 ppb
Volume of unknown = 10.00 mL
(g)
Interpretation:
The standard deviation of the result in (f) should be determined
Concept introduction:
Sv − standard deviation in volume
Sy − standard deviation in signal
m −slope
N − number of points
Sc − standard deviation in concentration
Answer to Problem 15.16QAP
Explanation of Solution
Want to see more full solutions like this?
Chapter 15 Solutions
PRINCIPLES OF INSTRUMENTAL ANALYSIS

- Calculate the pH and the pOH of each of the following solutions at 25 °C for which the substances ionize completely: (a) 0.000259 M HClO4arrow_forwardWhat is the pH of a 1.0 L buffer made with 0.300 mol of HF (Ka = 6.8 × 10⁻⁴) and 0.200 mol of NaF to which 0.160 mol of NaOH were added?arrow_forwardDetermine if the following salt is neutral, acidic or basic. If acidic or basic, write the appropriate equilibrium equation for the acid or base that exists when the salt is dissolved in aqueous solution. If neutral, simply write only NR. Be sure to include the proper phases for all species within the reaction. NaN₃arrow_forward
- A. Draw the structure of each of the following alcohols. Then draw and name the product you would expect to produce by the oxidation of each. a. 4-Methyl-2-heptanol b. 3,4-Dimethyl-1-pentanol c. 4-Ethyl-2-heptanol d. 5,7-Dichloro-3-heptanolarrow_forwardWhat is the pH of a 1.0 L buffer made with 0.300 mol of HF (Ka = 6.8 × 10⁻⁴) and 0.200 mol of NaF to which 0.160 mol of NaOH were added?arrow_forwardCan I please get help with this.arrow_forward
- Determine if the following salt is neutral, acidic or basic. If acidic or basic, write the appropriate equilibrium equation for the acid or base that exists when the salt is dissolved in aqueous solution. If neutral, simply write only NR. Be sure to include the proper phases for all species within the reaction. N₂H₅ClO₄arrow_forwardPlease help me with identifying these.arrow_forwardCan I please get help with this?arrow_forward
 Principles of Instrumental AnalysisChemistryISBN:9781305577213Author:Douglas A. Skoog, F. James Holler, Stanley R. CrouchPublisher:Cengage Learning
 Macroscale and Microscale Organic ExperimentsChemistryISBN:9781305577190Author:Kenneth L. Williamson, Katherine M. MastersPublisher:Brooks Cole