Horngren's Financial & Managerial Accounting (5th Edition)
5th Edition
ISBN: 9780133866292
Author: Tracie L. Miller-Nobles, Brenda L. Mattison, Ella Mae Matsumura
Publisher: PEARSON
expand_more
expand_more
format_list_bulleted
Textbook Question
Chapter 15, Problem 15.12SE
Using ratios to reconstruct a
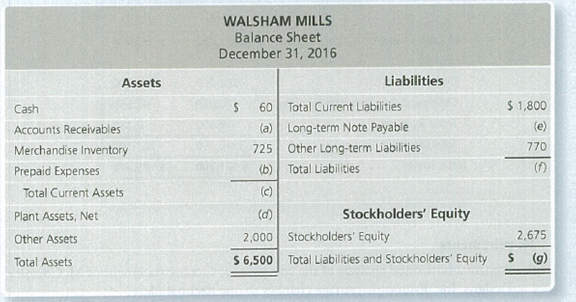
Walsham Mills's balance sheet appears as follows (amounts in thousands):

Use the following ratio data to complete Walsham Mills's balance sheet.
- a.
Current ratio is 0.86. - b. Acid-test ratio is 0.40.
Expert Solution & Answer
Want to see the full answer?
Check out a sample textbook solution
Students have asked these similar questions
I don't need ai answer general accounting question
What is the firm's debt equity ratio accounting question
Need answer
Chapter 15 Solutions
Horngren's Financial & Managerial Accounting (5th Edition)
Ch. 15 - What part of the Libertys annual report is written...Ch. 15 - Horizontal analysis of Liberty's balance sheet for...Ch. 15 - Vertical analysis of Liberty's balance sheet for...Ch. 15 - Which statement best describes Liberty's acid-test...Ch. 15 - Liberty's inventory turnover during 2017 was...Ch. 15 - Prob. 6QCCh. 15 - Prob. 7QCCh. 15 - Liberty's rate of return on common stockholders'...Ch. 15 - The company has 2,500 shares of common stock...Ch. 15 - Prob. 10AQC
Ch. 15 - What ate the three main ways to analyze financial...Ch. 15 - What is an annual report? Briefly describe the key...Ch. 15 - Prob. 3RQCh. 15 - What is trend analysis, and how does it differ...Ch. 15 - Prob. 5RQCh. 15 - Prob. 6RQCh. 15 - Prob. 7RQCh. 15 - Briefly describe the ratios that can be used to...Ch. 15 - Prob. 9RQCh. 15 - Briefly describe the ratios that can be used to...Ch. 15 - Briefly describe the ratios that can be used to...Ch. 15 - Prob. 12RQCh. 15 - Prob. 13RQCh. 15 - Prob. 14RQCh. 15 - Prob. 15RQCh. 15 - Prob. 15.1SECh. 15 - Performing horizontal analysis McDonald Corp....Ch. 15 - Calculating trend analysis Variline Corp. reported...Ch. 15 - Performing vertical analysis Hoosier Optical...Ch. 15 - Preparing common-size income statement Data for...Ch. 15 - Shine's Companies, a home improvement store chain,...Ch. 15 - Shine's Companies, a home improvement store chain,...Ch. 15 - Shine's Companies, a home improvement store chain,...Ch. 15 - Prob. 15.9SECh. 15 - Prob. 15.10SECh. 15 - Prob. 15.11SECh. 15 - Using ratios to reconstruct a balance sheet...Ch. 15 - Prob. 15.13SECh. 15 - Prob. 15.14SECh. 15 - Prob. 15.15ECh. 15 - Computing trend analysis Grand Oaks Realty's net...Ch. 15 - Prob. 15.17ECh. 15 - Prob. 15.18ECh. 15 - Prob. 15.19ECh. 15 - Prob. 15.20ECh. 15 - Analyzing the ability to pay liabilities Big Bend...Ch. 15 - Analyzing profitability Varsity, Inc.s comparative...Ch. 15 - Prob. 15.23ECh. 15 - Using ratios to reconstruct a balance sheet The...Ch. 15 - Prob. 15.25ECh. 15 - Computing earnings per share Falconi Academy...Ch. 15 - Prob. 15.27APCh. 15 - Prob. 15.28APCh. 15 - Prob. 15.29APCh. 15 - Prob. 15.30APCh. 15 - Using ratios to evaluate a stock investment...Ch. 15 - Prob. 15.32APCh. 15 - Preparing an income statement The following...Ch. 15 - Computing trend analysis and return on common...Ch. 15 - Prob. 15.35BPCh. 15 - Prob. 15.36BPCh. 15 - Determining the effects of business transactions...Ch. 15 - Prob. 15.38BPCh. 15 - Prob. 15.39BPCh. 15 - Prob. 15.40BPCh. 15 - Prob. 15.41CPCh. 15 - Lance Berkman is the controller of Saturn, a dance...Ch. 15 - Prob. 15.1CTEI
Knowledge Booster
Learn more about
Need a deep-dive on the concept behind this application? Look no further. Learn more about this topic, accounting and related others by exploring similar questions and additional content below.Similar questions
- Tower Company owned a service truck that was purchased at the beginning of Year 1 for $48,000. It had an estimated life of three years and an estimated salvage value of $3,000. Tower company uses straight-line depreciation. Its financial condition as of January 1, Year 3, is shown on the first line of the horizontal statements model. In Year 3, Tower Company spent the following amounts on the truck: January 4 Overhauled the engine for $7,600. The estimated life was extended one additional year, and the salvage value was revised to $2,000. July 6 Obtained oil change and transmission service, $410. August 7 Replaced the fan belt and battery, $510. December 31 Purchased gasoline for the year, $9,100. December 31 Recognized Year 3 depreciation expense. Required Record the Year 3 transactions in a statements model. Note: In the Statement of Cash Flows column, use the initials OA for operating activities, FA for financing activities, or IA for investing activity. Enter any decreases to…arrow_forwardCara's Cookie Company provided the following accounts from its year-end trial balance. (Click the icon to view the year-end trial balance accounts.) The company is subject to a 35% income tax rate. Requirement Prepare a multiple-step income statement for the current year. Trial balance Cara's Cookie Company Adjusted Trial Balance (Selected Accounts) For the Current Year Ended Account Debit Credit Prepare Cara's multiple-step income statement for the current year, one section at a time. (List the subheadings in the order they Cara's Cookie Company Statement of Net Income Common Stock (no par): Beginning Balance Retained Earnings: Beginning Balance $ 462,000 1,200,000 Accumulated Other Comprehensive Income: Beginning Balance Dividends $ 63,000 69,000 Sales 3,200,000 For the Current Year Ended Sales Less: Cost of Goods Sold 3,200,000 610,000 Interest Income 3,800 Dividend Income 3,600 Gross Profit Operating Expenses: Selling Expenses: Gain on Disposal of Plant Assets 92,000 2,590,000…arrow_forwardHistory 口 AA 1 ୪ Fri Feb 14 2:45 PM Mc Gw Mini Cases Qmcgrow hill goodweek tires pr × | Ask a Question | bartleby × + Bookmarks Profiles Tab Window Help Graw McGraw Hill MC ☑ Hill prod.reader-ui.prod.mheducation.com/epub/sn_d82a5/data-uuid-0e12dd568f3f4e438c00faed4ea436f1 Chrome File Edit View Λ LTI Launch 88 Netflix YouTube A BlackBoard Mail - Stiffler, Zac... SBI Jobs E Aa Finish update: ☐ All Bookmarks Goodweek Tires, Inc. After extensive research and development, Goodweek Tires, Inc., has recently developed a new tire, the SuperTread, and must decide whether to make the investment necessary to produce and market it. The tire would be ideal for drivers doing a large amount of wet weather and off-road driving in addition to normal freeway usage. The research and development costs so far have totaled about $10 million. The SuperTread would be put on the market beginning this year, and Goodweek expects it to stay on the market for a total of four years. Test marketing costing $5…arrow_forward
- Damerly Company (a Utah employer) wants to give a holiday bonus check of $375 to each employee. As it wants the check amount to be $375, it will need to gross-up the amount of the bonus. Calculate the withholding taxes and the gross amount of the bonus to be made to John Rolen if his cumulative earnings for the year are $46,910. Besides being subject to social security taxes and federal income tax (supplemental rate), a 4.95% Utah income tax must be withheld on supplemental payments.arrow_forwardPlease given correct answer general Accountingarrow_forwardHii ticher please given correct answer general Accountingarrow_forward
arrow_back_ios
SEE MORE QUESTIONS
arrow_forward_ios
Recommended textbooks for you
 Managerial AccountingAccountingISBN:9781337912020Author:Carl Warren, Ph.d. Cma William B. TaylerPublisher:South-Western College Pub
 Financial AccountingAccountingISBN:9781337272124Author:Carl Warren, James M. Reeve, Jonathan DuchacPublisher:Cengage LearningCentury 21 Accounting Multicolumn JournalAccountingISBN:9781337679503Author:GilbertsonPublisher:Cengage
 Managerial Accounting: The Cornerstone of Busines...AccountingISBN:9781337115773Author:Maryanne M. Mowen, Don R. Hansen, Dan L. HeitgerPublisher:Cengage Learning
 College Accounting, Chapters 1-27AccountingISBN:9781337794756Author:HEINTZ, James A.Publisher:Cengage Learning,

Managerial Accounting
Accounting
ISBN:9781337912020
Author:Carl Warren, Ph.d. Cma William B. Tayler
Publisher:South-Western College Pub

Financial Accounting
Accounting
ISBN:9781337272124
Author:Carl Warren, James M. Reeve, Jonathan Duchac
Publisher:Cengage Learning

Century 21 Accounting Multicolumn Journal
Accounting
ISBN:9781337679503
Author:Gilbertson
Publisher:Cengage

Managerial Accounting: The Cornerstone of Busines...
Accounting
ISBN:9781337115773
Author:Maryanne M. Mowen, Don R. Hansen, Dan L. Heitger
Publisher:Cengage Learning

College Accounting, Chapters 1-27
Accounting
ISBN:9781337794756
Author:HEINTZ, James A.
Publisher:Cengage Learning,

Financial ratio analysis; Author: The Finance Storyteller;https://www.youtube.com/watch?v=MTq7HuvoGck;License: Standard Youtube License