The color change accompanying the reaction of phenolphthalein with strong base is illustrated below. The change in concentration of the dye can be followed by spectrophotometry (Section 4.9), and some data collected by that approach are given below. The initial concentrations were [phenolphthalein] = 0.0050 mol/L and [OH ‒ ] = 0.61 mol/L. (Data are taken from review materials for kinetics at chemed.chem.purdue.edu.) (For more details on this reaction see L Nicholson, Journal of Chemical Education, Vol. 66, p. 725, 1989.) (a) Plot the data above as [phenolphthalein] versus time, and determine the average rate from t = 0 to t = 15 seconds and from t = 100 seconds to t = 125 seconds. Does the rate change? If so, why? (b) Use a graphical method to determine the order of the reaction with respect to phenolphthalein. Write the rate law, and determine the rate constant. (c) What is the half-life for the reaction?
The color change accompanying the reaction of phenolphthalein with strong base is illustrated below. The change in concentration of the dye can be followed by spectrophotometry (Section 4.9), and some data collected by that approach are given below. The initial concentrations were [phenolphthalein] = 0.0050 mol/L and [OH ‒ ] = 0.61 mol/L. (Data are taken from review materials for kinetics at chemed.chem.purdue.edu.) (For more details on this reaction see L Nicholson, Journal of Chemical Education, Vol. 66, p. 725, 1989.) (a) Plot the data above as [phenolphthalein] versus time, and determine the average rate from t = 0 to t = 15 seconds and from t = 100 seconds to t = 125 seconds. Does the rate change? If so, why? (b) Use a graphical method to determine the order of the reaction with respect to phenolphthalein. Write the rate law, and determine the rate constant. (c) What is the half-life for the reaction?
Solution Summary: The author analyzes the graph plotted between [Phenolphthalein] and time. The average rate of a reaction is defined by the change in concentration of substrate or target (product).
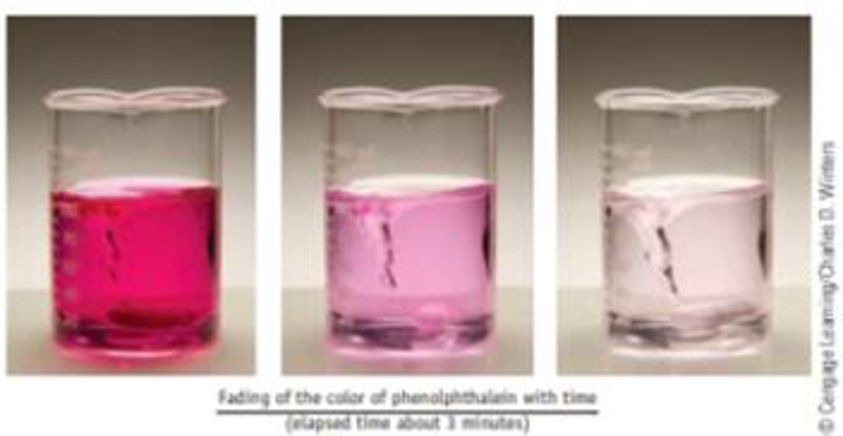
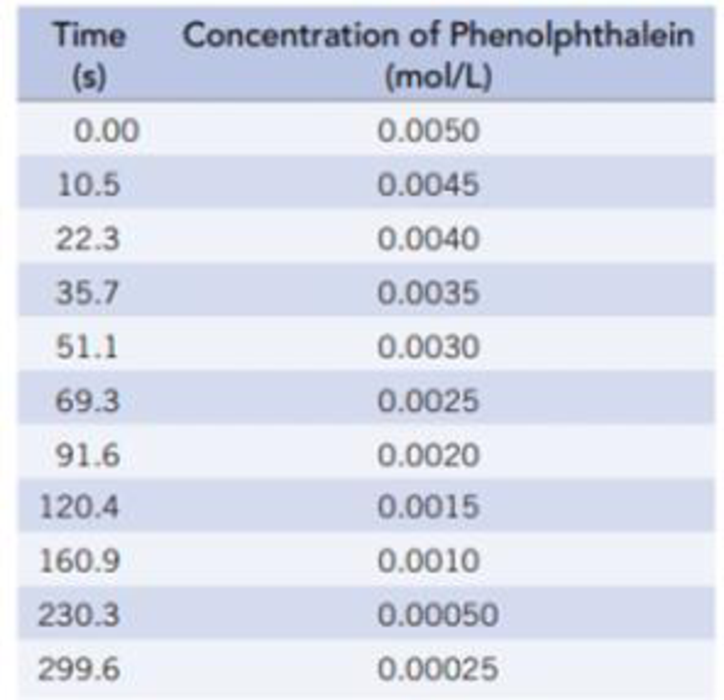
The color change accompanying the reaction of phenolphthalein with strong base is illustrated below. The change in concentration of the dye can be followed by spectrophotometry (Section 4.9), and some data collected by that approach are given below. The initial concentrations were [phenolphthalein] = 0.0050 mol/L and [OH‒] = 0.61 mol/L. (Data are taken from review materials for kinetics at chemed.chem.purdue.edu.) (For more details on this reaction see L Nicholson, Journal of Chemical Education, Vol. 66, p. 725, 1989.)
(a) Plot the data above as [phenolphthalein] versus time, and determine the average rate from t = 0 to t = 15 seconds and from t = 100 seconds to t = 125 seconds. Does the rate change? If so, why?
(b) Use a graphical method to determine the order of the reaction with respect to phenolphthalein. Write the rate law, and determine the rate constant.
9. OA. Rank the expected boiling points of the compounds shown below from highest to lowest. Place your answer
appropriately in the box. Only the answer in the box will be graded. (3) points)
OH
OH
بر بد بدید
2
3
There is an instrument in Johnson 334 that measures total-reflectance x-ray fluorescence (TXRF) to do elemental analysis (i.e., determine what elements are present in a sample). A researcher is preparing a to measure calcium content in a series of well water samples by TXRF with an internal standard of vanadium (atomic symbol: V). She has prepared a series of standard solutions to ensure a linear instrument response over the expected Ca concentration range of 40-80 ppm. The concentrations of Ca and V (ppm) and the instrument response (peak area, arbitrary units) are shown below. Also included is a sample spectrum. Equation 1 describes the response factor, K, relating the analyte signal (SA) and the standard signal (SIS) to their respective concentrations (CA and CIS).
Ca, ppm
V, ppm
SCa, arb. units
SV, arb. units
20.0
10.0
14375.11
14261.02
40.0
10.0
36182.15
17997.10
60.0
10.0
39275.74
12988.01
80.0
10.0
57530.75
14268.54
100.0…
A mixture of 0.568 M H₂O, 0.438 M Cl₂O, and 0.710 M HClO are enclosed in a vessel at 25 °C.
H₂O(g) + C₁₂O(g) = 2 HOCl(g)
K = 0.0900 at 25°C
с
Calculate the equilibrium concentrations of each gas at 25 °C.
[H₂O]=
[C₁₂O]=
[HOCI]=
M
Σ
M
Need a deep-dive on the concept behind this application? Look no further. Learn more about this topic, chemistry and related others by exploring similar questions and additional content below.


 Chemistry for Engineering StudentsChemistryISBN:9781337398909Author:Lawrence S. Brown, Tom HolmePublisher:Cengage Learning
 Principles of Modern ChemistryChemistryISBN:9781305079113Author:David W. Oxtoby, H. Pat Gillis, Laurie J. ButlerPublisher:Cengage Learning
 Chemistry: Matter and ChangeChemistryISBN:9780078746376Author:Dinah Zike, Laurel Dingrando, Nicholas Hainen, Cheryl WistromPublisher:Glencoe/McGraw-Hill School Pub Co