Concept explainers
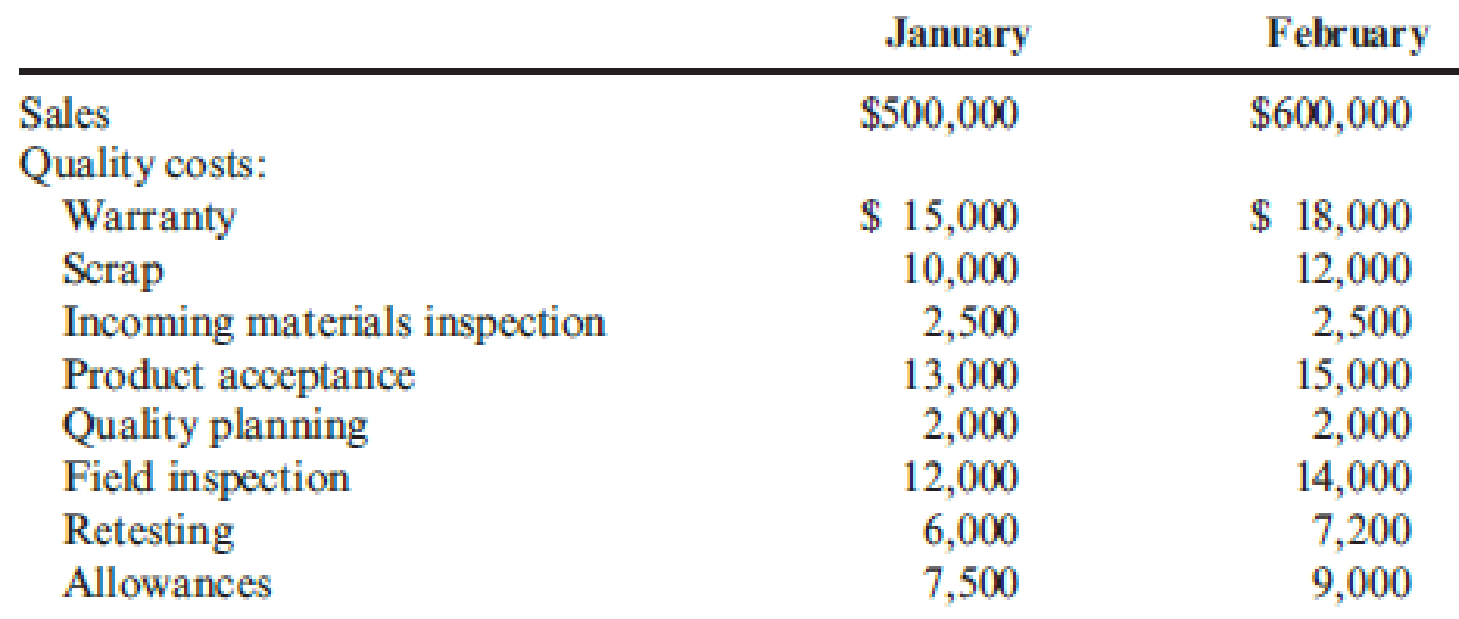
Recently, Ulrich Company received a report from an external consulting group on its quality costs. The consultants reported that the company’s quality costs total about 21 percent of its sales revenues. Somewhat shocked by the magnitude of the costs, Rob Rustin, president of Ulrich Company, decided to launch a major quality improvement program. For the coming year, management decided to reduce quality costs to 17 percent of sales revenues. Although the amount of reduction was ambitious, most company officials believed that the goal could be realized. To improve the monitoring of the quality improvement program, Rob directed Pamela Golding, the controller, to prepare monthly performance reports comparing budgeted and actual quality costs. Budgeted costs and sales for the first two months of the year are as follows:


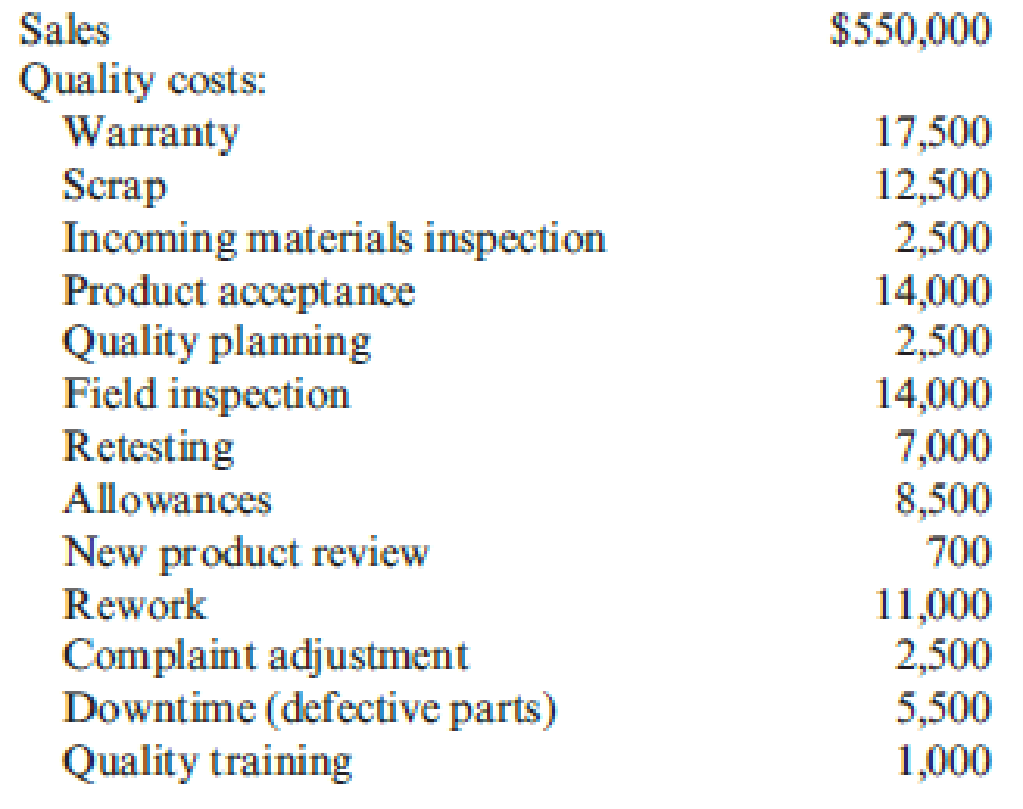
The following actual sales and actual quality costs were reported for January:

Required:
- 1. Reorganize the monthly budgets so that quality costs are grouped in one of four categories: appraisal, prevention, internal failure, or external failure. (Essentially, prepare a budgeted cost of quality report.) Also, identify each cost as variable (V) or fixed (F). (Assume that no costs are mixed.)
- 2. Prepare a performance report for January that compares actual costs with budgeted costs. Comment on the company’s progress in improving quality and reducing its quality costs.
1.
Reorganize the monthly budget, prepare a budgeted cost of quality report, and identify the type of cost as variable (V) or fixed (F).
Explanation of Solution
Quality cost performance reports: In a quality cost performance report, identification of quality standard is the main element and it has two important elements namely; actual outcomes and expected or standard outcomes.
Interim quality report: Interim quality performance report compares the actual quality at the end of the period with the budgeted costs and this report examines the progress attained within the period comparative to the planned level of progress for that period.
“Reorganize the monthly budget, prepare a budgeted cost of quality report, and identify the type of cost as variable (V) or fixed (F)”:
| Prevention costs | January | February |
| Quality planning (F) | $2,000 | $2,000 |
| New product review(F) | $500 | $500 |
| Quality training(F) | $1,000 | $1,000 |
| Total prevention costs | $3,500 | $3,500 |
| Appraisal costs | ||
| Materials inspection(F) | $2,500 | $2,500 |
| Product acceptance (V) | $13,000 | $15,000 |
| Field inspection (V) | $12,000 | $14,000 |
| Total appraisal costs | ||
| Internal failure costs | ||
| Scrap(V) | $10,000 | $12,000 |
| Retesting(V) | $6,000 | $7,200 |
| Rework(V) | $9,000 | $10,800 |
| Downtime(V) | $5,000 | $6,000 |
| Total internal failure costs | $30,000 | $36,000 |
| External failure costs | ||
| Warranty(V) | $15,000 | $18,000 |
| Allowances(V) | $7,500 | $9,000 |
| Complaint adjustment(F) | $2,500 | $2,500 |
| Total external failure costs | $25,000 | $29,500 |
| Total quality costs | $86,000 | $100,500 |
Table (1)
2.
Prepare a performance report for January that compares actual costs with budgeted costs. Comment on the progress of the company for improving quality and reducing its quality costs.
Explanation of Solution
Prepare a performance report comparing actual costs with budgeted costs and Comment on the progress of the company:
| Prevention costs: |
Actual costs (a) |
Budgeted Costs (b) |
Variance | |
| Quality planning (F) | $2,500 | $2,000 | $500 | U |
| New product review (F) | $700 | $500 | $200 | U |
| Quality training (F) | $1,000 | $1,000 | $0 | |
| Total prevention costs | $4,200 | $3,500 | $700 | U |
| Materials inspection (F) | $2,500 | $2,500 | $0 | |
| Product acceptance (V) | $14,000 | (2)$14,300 | ($300) | F |
| Field inspection (V) | $14,000 | (2)$13,200 | $800 | U |
| Total appraisal costs | $30,500 | $30,000 | $500 | U |
| Internal failure costs: | ||||
| Scrap (V) | $12,500 | (3)$11,000 | $1,500 | U |
| Retesting (V) | $7,000 | (4)$6,600 | $400 | U |
| Rework (V) | $11,000 | (5)$9,900 | $1,100 | U |
| Downtime (V) | $5,500 | (6)$5,500 | $0 | |
| Total internal failure costs | $36,000 | $33,000 | $3,000 | U |
| External failure costs: | ||||
| Warranty (V) | $17,500 | (7)$16,500 | $1,000 | U |
| Allowances (V) | $8,500 | (8)$8,250 | $250 | U |
| Complaint adjustment (F) | $2,500 | $2,500 | $0 | |
| Total external failure costs | $28,500 | $27,250 | $1,250 | U |
| Total quality costs | $99,200 | $93,750 | $5,450 | U |
Table (2)
- Budgeted costs must be adjusted to reflect actual sales of $550, 000; fixed costs usually don’t change with sales. Conversely, variable costs change with sales so that the “budgeted variable cost” could be used for making adjustment. For instance, the adjusted budgeted for scrap is $11,000(3).
- During the month of January, quality costs are 18 % (9) of sales and this is higher than the budgeted amount of 17 %, but lesser than earlier periods.
Working notes:
(1)Calculate the adjusted budget for product acceptance:
(2)Calculate the adjusted budget for field inspection:
(3)Calculate the adjusted budget for scrap:
(4)Calculate the adjusted budget for retesting:
(5)Calculate the adjusted budget for rework:
(6)Calculate the adjusted budget for downtime:
(7)Calculate the adjusted budget for warranty:
(8)Calculate the adjusted budget for allowances:
Note: Every amount of quality cost and the amount of sales is taken for the month of January.
(9)Calculate the percent of sales:
Want to see more full solutions like this?
Chapter 14 Solutions
EBK CORNERSTONES OF COST MANAGEMENT
- MCQarrow_forwardCorrect answerarrow_forwardMarin Company is a manufacturer of smartphones. Its controller resigned in October 2025. An inexperienced assistant accountant has prepared the following income statement for the month of October 2025. Marin Company Income Statement For the Month Ended October 31, 2025 Sales revenue $998,400 Less: Operating expenses Raw materials purchases $337,920 Direct labor cost 243,200 Advertising expense 115,200 Selling and administrative salaries 96,000 Rent on factory facilities 76,800 Depreciation on sales equipment 57,600 Depreciation on factory equipment 39,680 Indirect labor cost 35,840 Utilities expense 15,360 Insurance expense 10,240 1,027,840 Net loss $(29,440) Prior to October 2025, the company had been profitable every month. The company's president is concerned about the accuracy of the income statement. As her friend, you have been asked to review the income statement and make necessary corrections. After examining other manufacturing cost data, you have acquired additional…arrow_forward
- Provide answerarrow_forwardMCQarrow_forwardExercise 3-12A (Algo) Conducting sensitivity analysis using a spreadsheet LO 3-5 Use the below table to answer the following questions. Selling Price$27.00 Variable 2,100 3,100 Fixed Cost Cost Sales Volume 4,100 Profitability 5,100 6,100 $25,700 8 $14,200 $33,200 $52,200 $71,200 $90,200 25,700 9 12,100 30,100 48,100 66,100 84,100 25,700 10 10,000 27,000 44,000 61,000 78,000 35,700 8 4,200 23,200 42,200 61,200 80,200 35,700 9 2,100 20,100 38,100 56,100 74,100 35,700 10 17,000 34,000 51,000 68,000 45,700 8 (5,800) 13,200 32,200 51,200 70,200 45,700 9 (7,900) 10,100 28,100 46,100 64,100 45,700 10 (10,000) 7,000 24,000 41,000 58,000 Required a. Determine the sales volume, fixed cost, and variable cost per unit at the break-even point. b. Determine the expected profit if Rundle projects the following data for Delatine: sales, 4,100 bottles; fixed cost, $25,700; and variable cost per unit, $10. c. Rundle is considering new circumstances that would change the conditions described in…arrow_forward
 Cornerstones of Cost Management (Cornerstones Ser...AccountingISBN:9781305970663Author:Don R. Hansen, Maryanne M. MowenPublisher:Cengage Learning
 Managerial Accounting: The Cornerstone of Busines...AccountingISBN:9781337115773Author:Maryanne M. Mowen, Don R. Hansen, Dan L. HeitgerPublisher:Cengage LearningPrinciples of Accounting Volume 2AccountingISBN:9781947172609Author:OpenStaxPublisher:OpenStax College


