
Concept explainers
Videos
Hurricanes Select a random sample of eight storms by using random numbers, and find the average maximum wind speed. Compare with the population
Wind Speed of Hurricanes
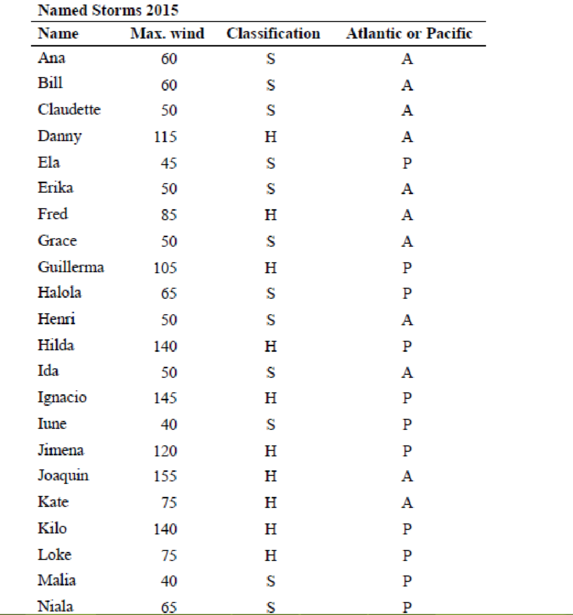
The 2015 Atlantic hurricane season was notable for many reasons, among them the most named storms and the most hurricanes. Use the data shown to answer questions 1 through 4.
The average maximum wind speed
To compare: The results with the population mean.
Answer to Problem 14.1.1RE
The average maximum wind speed is 97.5
By comparing the means it is clear that there is larger difference between the sample mean and the population mean
Explanation of Solution
Calculation:
First arrange the data according to the serial number,
| SNO | Name | Max. wind | Classification | Atlantic/pacific |
| 1 | Ana | 60 | S | A |
| 2 | Bill | 60 | S | A |
| 3 | Claudette | 50 | S | A |
| 4 | Danny | 115 | H | A |
| 5 | Ela | 45 | S | P |
| 6 | Erika | 50 | S | A |
| 7 | Fred | 85 | H | A |
| 8 | Grace | 50 | S | A |
| 9 | Guillerma | 105 | H | P |
| 10 | Halola | 65 | S | P |
| 11 | Henri | 50 | S | A |
| 12 | Hilda | 140 | H | P |
| 13 | Ida | 50 | S | A |
| 14 | Ignacio | 145 | H | P |
| 15 | Iune | 40 | S | P |
| 16 | Jimena | 120 | H | P |
| 17 | Joaquin | 155 | H | A |
| 18 | kate | 75 | H | A |
| 19 | Kilo | 140 | H | P |
| 20 | Loke | 75 | H | P |
| 21 | Malia | 40 | S | P |
| 22 | Naila | 65 | S | P |
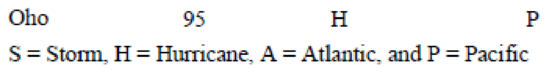
| 23 | oho | 95 | H | P |
From the data select a random sample of eight storms by using random numbers.
Procedure for selecting eight random samples:
- From the figure 14.1(Table of random numbers), select a starting point.
- Here, the selected starting point is ‘18’ which is present in third row and first column. There are 23 names of storms. Hence; select the random numbers in the range of ‘1’ to ‘23’. Avoid repetition of numbers and 00.
- The random numbers starting from ‘18’ are,
18,19,14,29,01,55,84,62,66,48,94,100,46,77,81,40,41,52,13,82,57,12,27,75,95,62,57,13,31,06,16
- Select 18, 19,14 which are in the range (01 to 23).
- Next number 29 is not selected because it is not in the range (1 to 23).
- And select 01.
- Repeat the same until eight random numbers are obtained.
- Thus, the random numbers are and corresponding names of the wind are,
| S NO | NAME |
| 01 | Ana |
| 06 | Erika |
| 12 | Hilda |
| 13 | Ida |
| 14 | Ignacio |
| 16 | Jimena |
| 18 | Kate |
| 19 | kilo |
The average maximum wind of above selected sample is calculated by using the following formula.
Thus, the sample mean is 97.5
The population mean of maximum wind is,
Comparison of means:
The sample mean of maximum wind speed is 97.5and the population mean of maximum wind speed is 81.52.
That implies that the sample mean is larger than the population mean.It is clear that there is larger difference between the sample mean and the population mean.
Want to see more full solutions like this?
Chapter 14 Solutions
ELEMENTARY STATISTICS: STEP BY STEP- ALE


- A company found that the daily sales revenue of its flagship product follows a normal distribution with a mean of $4500 and a standard deviation of $450. The company defines a "high-sales day" that is, any day with sales exceeding $4800. please provide a step by step on how to get the answers in excel Q: What percentage of days can the company expect to have "high-sales days" or sales greater than $4800? Q: What is the sales revenue threshold for the bottom 10% of days? (please note that 10% refers to the probability/area under bell curve towards the lower tail of bell curve) Provide answers in the yellow cellsarrow_forwardFind the critical value for a left-tailed test using the F distribution with a 0.025, degrees of freedom in the numerator=12, and degrees of freedom in the denominator = 50. A portion of the table of critical values of the F-distribution is provided. Click the icon to view the partial table of critical values of the F-distribution. What is the critical value? (Round to two decimal places as needed.)arrow_forwardA retail store manager claims that the average daily sales of the store are $1,500. You aim to test whether the actual average daily sales differ significantly from this claimed value. You can provide your answer by inserting a text box and the answer must include: Null hypothesis, Alternative hypothesis, Show answer (output table/summary table), and Conclusion based on the P value. Showing the calculation is a must. If calculation is missing,so please provide a step by step on the answers Numerical answers in the yellow cellsarrow_forward
 Glencoe Algebra 1, Student Edition, 9780079039897...AlgebraISBN:9780079039897Author:CarterPublisher:McGraw Hill
 Holt Mcdougal Larson Pre-algebra: Student Edition...AlgebraISBN:9780547587776Author:HOLT MCDOUGALPublisher:HOLT MCDOUGAL
 Big Ideas Math A Bridge To Success Algebra 1: Stu...AlgebraISBN:9781680331141Author:HOUGHTON MIFFLIN HARCOURTPublisher:Houghton Mifflin Harcourt