Concept explainers
Videos
Consider the following pH curves for 100.0 mL of two different acids with the same initial concentration each titrated by 0.10 M NaOH.
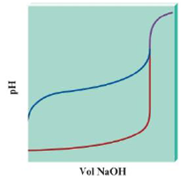
a. Which plot represents a pH curve of a weak acid, and which plot is for a strong acid? How can you tell? Cite three differences between the plots that help you decide.
b. In both cases the pH is relatively constant before the pH changes greatly. Does this mean that at some point in each titration each solution was a buffered solution?
c. True or false? The equivalence point volume for each titration is the same. Explain your answer.
d. True or false? The pH at the equivalence point for each titration is the same. Explain your answer.
Want to see the full answer?
Check out a sample textbook solution
Chapter 14 Solutions
Bundle: Chemistry: An Atoms First Approach, 2nd, Loose-Leaf + OWLv2, 4 terms (24 months) Printed Access Card
Additional Science Textbook Solutions
Biology: Life on Earth with Physiology (11th Edition)
Campbell Essential Biology (7th Edition)
General, Organic, and Biological Chemistry - 4th edition
Organic Chemistry
Campbell Biology (11th Edition)


- What is the final product when D-galactose reacts with hydroxylamine?arrow_forwardIndicate the formula of the product obtained by reacting methyl 5-chloro-5-oxopentanoate with 1 mole of 4-penten-1-ylmagnesium bromide.arrow_forwardIn the two chair conformations of glucose, the most stable is the one with all the OH groups in the equatorial position. Is this correct?arrow_forward
- please help me with my homeworkarrow_forwardhelparrow_forwardThe temperature on a sample of pure X held at 1.25 atm and -54. °C is increased until the sample boils. The temperature is then held constant and the pressure is decreased by 0.42 atm. On the phase diagram below draw a path that shows this set of changes. pressure (atm) 2 0 0 200 400 temperature (K) Xarrow_forward
- QUESTION: Answer Question 5: 'Calculating standard error of regression' STEP 1 by filling in all the empty green boxes *The values are all provided in the photo attached*arrow_forwardpressure (atm) 3 The pressure on a sample of pure X held at 47. °C and 0.88 atm is increased until the sample condenses. The pressure is then held constant and the temperature is decreased by 82. °C. On the phase diagram below draw a path that shows this set of changes. 0 0 200 temperature (K) 400 аarrow_forwarder your payment details | bar xb Home | bartleby x + aleksogi/x/isl.exe/1o u-lgNskr7j8P3jH-1Qs_pBanHhviTCeeBZbufuBYT0Hz7m7D3ZcW81NC1d8Kzb4srFik1OUFhKMUXzhGpw7k1 O States of Matter Sketching a described thermodynamic change on a phase diagram 0/5 The pressure on a sample of pure X held at 47. °C and 0.88 atm is increased until the sample condenses. The pressure is then held constant and the temperature is decreased by 82. °C. On the phase diagram below draw a path that shows this set of changes. pressure (atm) 1 3- 0- 0 200 Explanation Check temperature (K) 400 X Q Search L G 2025 McGraw Hill LLC. All Rights Reserved Terms of Use Privacy Cearrow_forward
 Chemistry: The Molecular ScienceChemistryISBN:9781285199047Author:John W. Moore, Conrad L. StanitskiPublisher:Cengage Learning
 Chemistry: Principles and PracticeChemistryISBN:9780534420123Author:Daniel L. Reger, Scott R. Goode, David W. Ball, Edward MercerPublisher:Cengage Learning
 Chemistry: Principles and ReactionsChemistryISBN:9781305079373Author:William L. Masterton, Cecile N. HurleyPublisher:Cengage Learning
 Chemistry & Chemical ReactivityChemistryISBN:9781337399074Author:John C. Kotz, Paul M. Treichel, John Townsend, David TreichelPublisher:Cengage Learning
 ChemistryChemistryISBN:9781305957404Author:Steven S. Zumdahl, Susan A. Zumdahl, Donald J. DeCostePublisher:Cengage Learning
 Chemistry: An Atoms First ApproachChemistryISBN:9781305079243Author:Steven S. Zumdahl, Susan A. ZumdahlPublisher:Cengage Learning