
Introductory Statistics
3rd Edition
ISBN: 9780135188927
Author: Gould, Robert, Ryan, Colleen N. (colleen Nooter)
Publisher: Pearson,
expand_more
expand_more
format_list_bulleted
Concept explainers
Videos
Textbook Question
Chapter 14, Problem 11SE
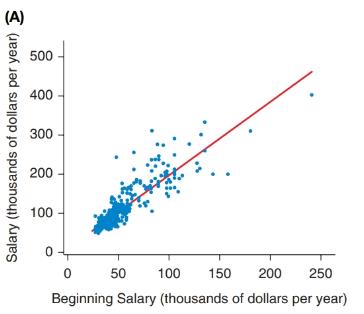
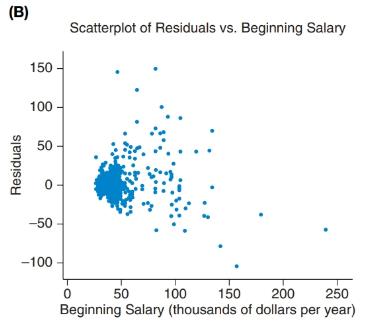
Salaries Figure A shows a
Expert Solution & Answer
Want to see the full answer?
Check out a sample textbook solution
Students have asked these similar questions
Find the critical value for a left-tailed test using the F distribution with a 0.025, degrees of freedom in the numerator=12, and degrees of freedom in the
denominator = 50. A portion of the table of critical values of the F-distribution is provided.
Click the icon to view the partial table of critical values of the F-distribution.
What is the critical value?
(Round to two decimal places as needed.)
A retail store manager claims that the average daily sales of the store are $1,500.
You aim to test whether the actual average daily sales differ significantly from this claimed value.
You can provide your answer by inserting a text box and the answer must include:
Null hypothesis,
Alternative hypothesis,
Show answer (output table/summary table), and
Conclusion based on the P value.
Showing the calculation is a must. If calculation is missing,so please provide a step by step on the answers
Numerical answers in the yellow cells
Show all work
Chapter 14 Solutions
Introductory Statistics
Ch. 14 - Predicting Test Scores A professor tells his class...Ch. 14 - Used-Car Values A student wishes to buy a used...Ch. 14 - Height and Age (Example 1) A doctor says he can...Ch. 14 - Units and Semesters The registrar at a small...Ch. 14 - Prob. 5SECh. 14 - Prob. 6SECh. 14 - Prob. 7SECh. 14 - Prob. 8SECh. 14 - Semesters and Credits (Example 4) Figure A shows a...Ch. 14 - Prob. 10SE
Ch. 14 - Salaries Figure A shows a scatterplot of the...Ch. 14 - Prob. 12SECh. 14 - Wages of Twins Figure A shows a scatterplot of...Ch. 14 - Simulated Data Figure A shows a scatterplot of...Ch. 14 - Prob. 15SECh. 14 - Movie Budgets Do movies with bigger budgets tend...Ch. 14 - Education of Parents (Example 7) Each of 29...Ch. 14 - Education of Parents Refer to exercise 14.17 and...Ch. 14 - Student and Parent Heights A random sample of 29...Ch. 14 - Trash The weight of trash (in pounds) produced by...Ch. 14 - Prob. 21SECh. 14 - Prob. 22SECh. 14 - Trash and Confidence Intervals The output provided...Ch. 14 - Movie Budgets In exercise 14.16 you examined the...Ch. 14 - Predicted GPA A student who has been accepted by...Ch. 14 - Used BMWs A used-car dealer is purchasing 50 used...Ch. 14 - Predicted Height (Example 9) A mother wants to...Ch. 14 - Predicted GPA A dean of students at a college...Ch. 14 - Loggers A logging company has the diameter of each...Ch. 14 - Prob. 30SECh. 14 - House Prices (Example 10) Figure A contains the...Ch. 14 - Math SAT Score and GPA Figure A shows information...Ch. 14 - Height and Weight A scatterplot of the heights and...Ch. 14 - Waist Size and Weight A scatterplot of the waist...Ch. 14 - GPA and SAT The figure shows 95#37; prediction...Ch. 14 - Shoes and Heights The scatterplot shows shoe size...Ch. 14 - Height and Weight A scatterplot of the heights and...Ch. 14 - Waist Size and Weight A scatterplot of the waist...Ch. 14 - Baseball Players Figure A shows a scatterplot with...Ch. 14 - Predicting Education Figure A shows a scatterplot...Ch. 14 - Life Expectancy and Gestation Periods for Animals...Ch. 14 - Prob. 42CRE
Additional Math Textbook Solutions
Find more solutions based on key concepts
(a) Make a stem-and-leaf plot for these 24 observations on the number of customers who used a down-town CitiBan...
APPLIED STAT.IN BUS.+ECONOMICS
Provide an example of a qualitative variable and an example of a quantitative variable.
Elementary Statistics ( 3rd International Edition ) Isbn:9781260092561
Silvia wants to mix a 40% apple juice drink with pure apple juice to make 2 L of a juice drink that is 80% appl...
Beginning and Intermediate Algebra
Find all solutions of each equation in the interval .
Precalculus: A Unit Circle Approach (3rd Edition)
NOTE: Write your answers using interval notation when appropriate.
CHECKING ANALYTIC SKILLS Fill in each blank ...
Graphical Approach To College Algebra
23. A plant nursery sells two sizes of oak trees to landscapers. Large trees cost the nursery $120 from the gro...
College Algebra (Collegiate Math)
Knowledge Booster


Learn more about
Need a deep-dive on the concept behind this application? Look no further. Learn more about this topic, statistics and related others by exploring similar questions and additional content below.Similar questions
- Show all workarrow_forwardplease find the answers for the yellows boxes using the information and the picture belowarrow_forwardA marketing agency wants to determine whether different advertising platforms generate significantly different levels of customer engagement. The agency measures the average number of daily clicks on ads for three platforms: Social Media, Search Engines, and Email Campaigns. The agency collects data on daily clicks for each platform over a 10-day period and wants to test whether there is a statistically significant difference in the mean number of daily clicks among these platforms. Conduct ANOVA test. You can provide your answer by inserting a text box and the answer must include: also please provide a step by on getting the answers in excel Null hypothesis, Alternative hypothesis, Show answer (output table/summary table), and Conclusion based on the P value.arrow_forward
- A company found that the daily sales revenue of its flagship product follows a normal distribution with a mean of $4500 and a standard deviation of $450. The company defines a "high-sales day" that is, any day with sales exceeding $4800. please provide a step by step on how to get the answers Q: What percentage of days can the company expect to have "high-sales days" or sales greater than $4800? Q: What is the sales revenue threshold for the bottom 10% of days? (please note that 10% refers to the probability/area under bell curve towards the lower tail of bell curve) Provide answers in the yellow cellsarrow_forwardBusiness Discussarrow_forwardThe following data represent total ventilation measured in liters of air per minute per square meter of body area for two independent (and randomly chosen) samples. Analyze these data using the appropriate non-parametric hypothesis testarrow_forward
arrow_back_ios
SEE MORE QUESTIONS
arrow_forward_ios
Recommended textbooks for you


 Functions and Change: A Modeling Approach to Coll...AlgebraISBN:9781337111348Author:Bruce Crauder, Benny Evans, Alan NoellPublisher:Cengage Learning
 Algebra and Trigonometry (MindTap Course List)AlgebraISBN:9781305071742Author:James Stewart, Lothar Redlin, Saleem WatsonPublisher:Cengage Learning
 Glencoe Algebra 1, Student Edition, 9780079039897...AlgebraISBN:9780079039897Author:CarterPublisher:McGraw Hill
 College AlgebraAlgebraISBN:9781305115545Author:James Stewart, Lothar Redlin, Saleem WatsonPublisher:Cengage Learning
Functions and Change: A Modeling Approach to Coll...
Algebra
ISBN:9781337111348
Author:Bruce Crauder, Benny Evans, Alan Noell
Publisher:Cengage Learning
Algebra and Trigonometry (MindTap Course List)
Algebra
ISBN:9781305071742
Author:James Stewart, Lothar Redlin, Saleem Watson
Publisher:Cengage Learning
Glencoe Algebra 1, Student Edition, 9780079039897...
Algebra
ISBN:9780079039897
Author:Carter
Publisher:McGraw Hill
College Algebra
Algebra
ISBN:9781305115545
Author:James Stewart, Lothar Redlin, Saleem Watson
Publisher:Cengage Learning
Correlation Vs Regression: Difference Between them with definition & Comparison Chart; Author: Key Differences;https://www.youtube.com/watch?v=Ou2QGSJVd0U;License: Standard YouTube License, CC-BY
Correlation and Regression: Concepts with Illustrative examples; Author: LEARN & APPLY : Lean and Six Sigma;https://www.youtube.com/watch?v=xTpHD5WLuoA;License: Standard YouTube License, CC-BY