
Statistics: The Art and Science of Learning from Data (4th Edition)
4th Edition
ISBN: 9780321997838
Author: Alan Agresti, Christine A. Franklin, Bernhard Klingenberg
Publisher: PEARSON
expand_more
expand_more
format_list_bulleted
Videos
Textbook Question
Chapter 13.4, Problem 32PB
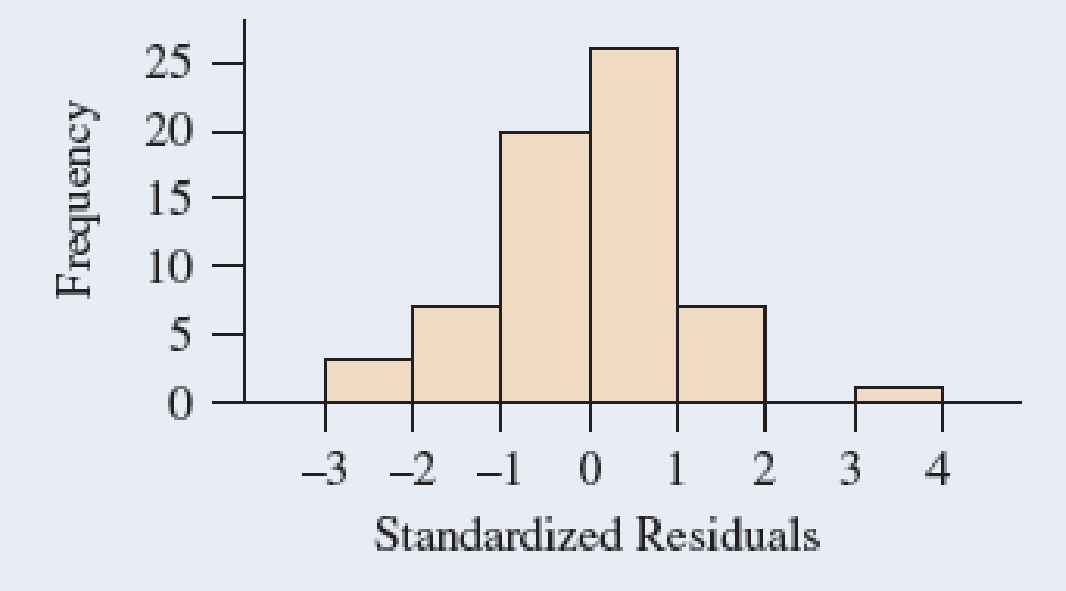
Body weight residuals Examples 4–7 used multiple regression to predict total body weight of college athletes in terms of height, percent body fat, and age. The following figure shows a histogram of the standardized residuals resulting from fitting this model.
- a. About which distribution do these give you information—the overall distribution of weight or the conditional distribution of weight at fixed values of the predictors?
- b. What does the histogram suggest about the likely shape of this distribution? Why?
Expert Solution & Answer
Want to see the full answer?
Check out a sample textbook solution
Students have asked these similar questions
if the b coloumn of a z table disappeared what would be used to determine b column probabilities
Construct a model of population flow between metropolitan and nonmetropolitan areas of a given country, given that their respective populations in 2015 were 263 million and 45 million. The probabilities
are given by the following matrix.
(from)
(to)
metro nonmetro
0.99 0.02 metro
0.01 0.98
nonmetro
Predict the population distributions of metropolitan and nonmetropolitan areas for the years 2016 through 2020 (in millions, to four decimal places). (Let x, through x5 represent the years 2016 through
2020, respectively.)
x₁ =
x2
X3
261.27
46.73
11
259.59
48.41
11
257.96
50.04
11
256.39
51.61
11
t
If the average price of a new one family home is $246,300 with a standard deviation of $15,000 find the minimum and maximum prices of the houses that a contractor will build to satisfy 88% of the market value
Chapter 13 Solutions
Statistics: The Art and Science of Learning from Data (4th Edition)
Ch. 13.1 - Predicting weight For a study of female college...Ch. 13.1 - Prob. 2PBCh. 13.1 - Predicting college GPA For all students at Walden...Ch. 13.1 - Prob. 4PBCh. 13.1 - Does more education cause more crime? The FL Crime...Ch. 13.1 - Crime rate and income Refer to the previous...Ch. 13.1 - The economics of golf The earnings of a PGA Tour...Ch. 13.1 - Prob. 8PBCh. 13.1 - Controlling can have no effect Suppose that the...Ch. 13.1 - House selling prices Using software with the House...
Ch. 13.1 - Used cars The following data (also available from...Ch. 13.2 - Predicting sports attendance Keeneland Racetrack...Ch. 13.2 - Predicting weight Lets use multiple regression to...Ch. 13.2 - Prob. 14PBCh. 13.2 - Price of used cars For the 19 used cars listed in...Ch. 13.2 - Prob. 16PBCh. 13.2 - Softball data For the Softball data set on the...Ch. 13.2 - Slopes, correlations, and units In Example 2 on y...Ch. 13.2 - Predicting college GPA Using software with the...Ch. 13.3 - Predicting GPA For the 59 observations in the...Ch. 13.3 - Study time help GPA? Refer to the previous...Ch. 13.3 - Variability in college GPA Refer to the previous...Ch. 13.3 - Does leg press help predict body strength? Chapter...Ch. 13.3 - Prob. 24PBCh. 13.3 - Interpret strength variability Refer to the...Ch. 13.3 - Any predictive power? Refer to the previous three...Ch. 13.3 - Predicting pizza revenue Aunt Ermas Pizza...Ch. 13.3 - Prob. 28PBCh. 13.3 - Mental health again Refer to the previous...Ch. 13.3 - Prob. 30PBCh. 13.3 - House prices Use software to do further analyses...Ch. 13.4 - Body weight residuals Examples 47 used multiple...Ch. 13.4 - Strength residuals In Chapter 12, we analyzed...Ch. 13.4 - Prob. 34PBCh. 13.4 - Nonlinear effects of age Suppose you fit a...Ch. 13.4 - Prob. 36PBCh. 13.4 - Why inspect residuals? When we use multiple...Ch. 13.4 - College athletes The College Athletes data set on...Ch. 13.4 - House prices Use software with the House Selling...Ch. 13.4 - Prob. 40PBCh. 13.5 - U.S. and foreign used cars Refer to the used car...Ch. 13.5 - Prob. 42PBCh. 13.5 - Predict using house size and condition For the...Ch. 13.5 - Quality and productivity The table shows data from...Ch. 13.5 - Predicting hamburger sales A chain restaurant that...Ch. 13.5 - Prob. 46PBCh. 13.5 - House size and garage interact? Refer to the...Ch. 13.5 - Prob. 48PBCh. 13.5 - Comparing sales You own a gift shop that has a...Ch. 13.6 - Prob. 50PBCh. 13.6 - Prob. 51PBCh. 13.6 - Prob. 52PBCh. 13.6 - Prob. 53PBCh. 13.6 - Prob. 54PBCh. 13.6 - Prob. 55PBCh. 13.6 - Prob. 56PBCh. 13.6 - Prob. 57PBCh. 13.6 - Prob. 58PBCh. 13.6 - Prob. 59PBCh. 13 - House prices This chapter has considered many...Ch. 13 - Prob. 61CPCh. 13 - Prob. 62CPCh. 13 - Prob. 63CPCh. 13 - Prob. 64CPCh. 13 - Prob. 65CPCh. 13 - Prob. 66CPCh. 13 - Prob. 67CPCh. 13 - Prob. 68CPCh. 13 - Prob. 69CPCh. 13 - AIDS and AZT In a study (reported in the New York...Ch. 13 - Factors affecting first home purchase The table...Ch. 13 - Unemployment and GDP Refer to Exercise 13.67. When...Ch. 13 - Prob. 75CPCh. 13 - Prob. 76CPCh. 13 - Prob. 77CPCh. 13 - Prob. 78CPCh. 13 - Prob. 79CPCh. 13 - True or false: Slopes For data on y = college GPA,...Ch. 13 - Prob. 81CPCh. 13 - Lurking variable Give an example of three...Ch. 13 - Prob. 83CPCh. 13 - Prob. 84CPCh. 13 - Prob. 85CPCh. 13 - Logistic versus linear For binary response...Ch. 13 - Prob. 87CPCh. 13 - Prob. 88CPCh. 13 - Prob. 89CPCh. 13 - Prob. 90CPCh. 13 - Prob. 91CPCh. 13 - Prob. 92CPCh. 13 - Prob. 93CP
Knowledge Booster


Learn more about
Need a deep-dive on the concept behind this application? Look no further. Learn more about this topic, statistics and related others by exploring similar questions and additional content below.Similar questions
- 21. ANALYSIS OF LAST DIGITS Heights of statistics students were obtained by the author as part of an experiment conducted for class. The last digits of those heights are listed below. Construct a frequency distribution with 10 classes. Based on the distribution, do the heights appear to be reported or actually measured? Does there appear to be a gap in the frequencies and, if so, how might that gap be explained? What do you know about the accuracy of the results? 3 4 555 0 0 0 0 0 0 0 0 0 1 1 23 3 5 5 5 5 5 5 5 5 5 5 5 5 6 6 8 8 8 9arrow_forwardA side view of a recycling bin lid is diagramed below where two panels come together at a right angle. 45 in 24 in Width? — Given this information, how wide is the recycling bin in inches?arrow_forward1 No. 2 3 4 Binomial Prob. X n P Answer 5 6 4 7 8 9 10 12345678 8 3 4 2 2552 10 0.7 0.233 0.3 0.132 7 0.6 0.290 20 0.02 0.053 150 1000 0.15 0.035 8 7 10 0.7 0.383 11 9 3 5 0.3 0.132 12 10 4 7 0.6 0.290 13 Poisson Probability 14 X lambda Answer 18 4 19 20 21 22 23 9 15 16 17 3 1234567829 3 2 0.180 2 1.5 0.251 12 10 0.095 5 3 0.101 7 4 0.060 3 2 0.180 2 1.5 0.251 24 10 12 10 0.095arrow_forward
- step by step on Microssoft on how to put this in excel and the answers please Find binomial probability if: x = 8, n = 10, p = 0.7 x= 3, n=5, p = 0.3 x = 4, n=7, p = 0.6 Quality Control: A factory produces light bulbs with a 2% defect rate. If a random sample of 20 bulbs is tested, what is the probability that exactly 2 bulbs are defective? (hint: p=2% or 0.02; x =2, n=20; use the same logic for the following problems) Marketing Campaign: A marketing company sends out 1,000 promotional emails. The probability of any email being opened is 0.15. What is the probability that exactly 150 emails will be opened? (hint: total emails or n=1000, x =150) Customer Satisfaction: A survey shows that 70% of customers are satisfied with a new product. Out of 10 randomly selected customers, what is the probability that at least 8 are satisfied? (hint: One of the keyword in this question is “at least 8”, it is not “exactly 8”, the correct formula for this should be = 1- (binom.dist(7, 10, 0.7,…arrow_forwardKate, Luke, Mary and Nancy are sharing a cake. The cake had previously been divided into four slices (s1, s2, s3 and s4). What is an example of fair division of the cake S1 S2 S3 S4 Kate $4.00 $6.00 $6.00 $4.00 Luke $5.30 $5.00 $5.25 $5.45 Mary $4.25 $4.50 $3.50 $3.75 Nancy $6.00 $4.00 $4.00 $6.00arrow_forwardFaye cuts the sandwich in two fair shares to her. What is the first half s1arrow_forward
- Question 2. An American option on a stock has payoff given by F = f(St) when it is exercised at time t. We know that the function f is convex. A person claims that because of convexity, it is optimal to exercise at expiration T. Do you agree with them?arrow_forwardQuestion 4. We consider a CRR model with So == 5 and up and down factors u = 1.03 and d = 0.96. We consider the interest rate r = 4% (over one period). Is this a suitable CRR model? (Explain your answer.)arrow_forwardQuestion 3. We want to price a put option with strike price K and expiration T. Two financial advisors estimate the parameters with two different statistical methods: they obtain the same return rate μ, the same volatility σ, but the first advisor has interest r₁ and the second advisor has interest rate r2 (r1>r2). They both use a CRR model with the same number of periods to price the option. Which advisor will get the larger price? (Explain your answer.)arrow_forward
- Question 5. We consider a put option with strike price K and expiration T. This option is priced using a 1-period CRR model. We consider r > 0, and σ > 0 very large. What is the approximate price of the option? In other words, what is the limit of the price of the option as σ∞. (Briefly justify your answer.)arrow_forwardQuestion 6. You collect daily data for the stock of a company Z over the past 4 months (i.e. 80 days) and calculate the log-returns (yk)/(-1. You want to build a CRR model for the evolution of the stock. The expected value and standard deviation of the log-returns are y = 0.06 and Sy 0.1. The money market interest rate is r = 0.04. Determine the risk-neutral probability of the model.arrow_forwardSeveral markets (Japan, Switzerland) introduced negative interest rates on their money market. In this problem, we will consider an annual interest rate r < 0. We consider a stock modeled by an N-period CRR model where each period is 1 year (At = 1) and the up and down factors are u and d. (a) We consider an American put option with strike price K and expiration T. Prove that if <0, the optimal strategy is to wait until expiration T to exercise.arrow_forward
arrow_back_ios
SEE MORE QUESTIONS
arrow_forward_ios
Recommended textbooks for you
 Glencoe Algebra 1, Student Edition, 9780079039897...AlgebraISBN:9780079039897Author:CarterPublisher:McGraw Hill
 Big Ideas Math A Bridge To Success Algebra 1: Stu...AlgebraISBN:9781680331141Author:HOUGHTON MIFFLIN HARCOURTPublisher:Houghton Mifflin Harcourt
 Holt Mcdougal Larson Pre-algebra: Student Edition...AlgebraISBN:9780547587776Author:HOLT MCDOUGALPublisher:HOLT MCDOUGAL
 Linear Algebra: A Modern IntroductionAlgebraISBN:9781285463247Author:David PoolePublisher:Cengage Learning
 Functions and Change: A Modeling Approach to Coll...AlgebraISBN:9781337111348Author:Bruce Crauder, Benny Evans, Alan NoellPublisher:Cengage Learning
Glencoe Algebra 1, Student Edition, 9780079039897...
Algebra
ISBN:9780079039897
Author:Carter
Publisher:McGraw Hill
Big Ideas Math A Bridge To Success Algebra 1: Stu...
Algebra
ISBN:9781680331141
Author:HOUGHTON MIFFLIN HARCOURT
Publisher:Houghton Mifflin Harcourt
Holt Mcdougal Larson Pre-algebra: Student Edition...
Algebra
ISBN:9780547587776
Author:HOLT MCDOUGAL
Publisher:HOLT MCDOUGAL
Linear Algebra: A Modern Introduction
Algebra
ISBN:9781285463247
Author:David Poole
Publisher:Cengage Learning
Functions and Change: A Modeling Approach to Coll...
Algebra
ISBN:9781337111348
Author:Bruce Crauder, Benny Evans, Alan Noell
Publisher:Cengage Learning
F- Test or F- statistic (F- Test of Equality of Variance); Author: Prof. Arvind Kumar Sing;https://www.youtube.com/watch?v=PdUt7InTyc8;License: Standard Youtube License
Statistics 101: F-ratio Test for Two Equal Variances; Author: Brandon Foltz;https://www.youtube.com/watch?v=UWQO4gX7-lE;License: Standard YouTube License, CC-BY
Hypothesis Testing and Confidence Intervals (FRM Part 1 – Book 2 – Chapter 5); Author: Analystprep;https://www.youtube.com/watch?v=vth3yZIUlGQ;License: Standard YouTube License, CC-BY
Understanding the Levene's Test for Equality of Variances in SPSS; Author: Dr. Todd Grande;https://www.youtube.com/watch?v=udJr8V2P8Xo;License: Standard Youtube License