A curve connecting points of equal atmospheric pressure on a weather map is called an isobar . On a typical weather map the isobars refer to pressure at mean sea level and are given in units of millibars (mb). Mathematically, isobars are level curves for the pressure function p x , y defined at the geographic points x , y represented on the map. Tightly packed isobars correspond to steep slopes on the graph of the pressure function, and these are usually associated with strong winds—the steeper the slope, the greater the speed of the wind. (a) Referring to the accompanying weather map, is the wind speed greater in Medicine Hat, Alberta or in Chicago? Explain your reasoning. (b) Estimate the average rate of change in atmospheric pressure (in mb/mi) from Medicine Hat to Chicago. given that the distance between the two cities is approximately 1400 mi.
A curve connecting points of equal atmospheric pressure on a weather map is called an isobar . On a typical weather map the isobars refer to pressure at mean sea level and are given in units of millibars (mb). Mathematically, isobars are level curves for the pressure function p x , y defined at the geographic points x , y represented on the map. Tightly packed isobars correspond to steep slopes on the graph of the pressure function, and these are usually associated with strong winds—the steeper the slope, the greater the speed of the wind. (a) Referring to the accompanying weather map, is the wind speed greater in Medicine Hat, Alberta or in Chicago? Explain your reasoning. (b) Estimate the average rate of change in atmospheric pressure (in mb/mi) from Medicine Hat to Chicago. given that the distance between the two cities is approximately 1400 mi.
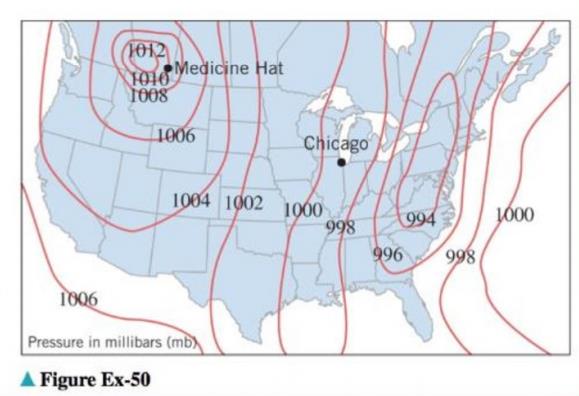
A curve connecting points of equal atmospheric pressure on a weather map is called an isobar. On a typical weather map the isobars refer to pressure at mean sea level and are given in units of millibars (mb). Mathematically, isobars are level curves for the pressure function
p
x
,
y
defined at the geographic points
x
,
y
represented on the map. Tightly packed isobars correspond to steep slopes on the graph of the pressure function, and these are usually associated with strong winds—the steeper the slope, the greater the speed of the wind.
(a) Referring to the accompanying weather map, is the wind speed greater in Medicine Hat, Alberta or in Chicago? Explain your reasoning.
(b) Estimate the average rate of change in atmospheric pressure (in mb/mi) from Medicine Hat to Chicago. given that the distance between the two cities is approximately 1400 mi.
After a great deal of experimentation, two college senior physics majors determined that when a bottle of French champagne is shaken several times, held upright, and uncorked,
its cork travels according to the function below, where s is its height (in feet) above the ground t seconds after being released.
s(t)=-16t² + 30t+3
a. How high will it go?
b. How long is it in the air?
+6x²+135x+1) (0≤x≤10). a) Find the number of units
The total profit P(x) (in thousands of dollars) from a sale of x thousand units of a new product is given by P(x) = In (-x²+6x² + 135x+
that should be sold in order to maximize the total profit. b) What is the maximum profit?
The fox population in a certain region has an annual growth rate of 8 percent per year. It is estimated that the
population in the year 2000 was 22600.
(a) Find a function that models the population t years after 2000 (t = 0 for 2000).
Your answer is P(t)
=
(b) Use the function from part (a) to estimate the fox population in the year 2008.
Your answer is (the answer should be an integer)
Chapter 13 Solutions
Calculus Early Transcendentals, Binder Ready Version
Need a deep-dive on the concept behind this application? Look no further. Learn more about this topic, calculus and related others by exploring similar questions and additional content below.


 Algebra & Trigonometry with Analytic GeometryAlgebraISBN:9781133382119Author:SwokowskiPublisher:Cengage
 Glencoe Algebra 1, Student Edition, 9780079039897...AlgebraISBN:9780079039897Author:CarterPublisher:McGraw Hill
 College Algebra (MindTap Course List)AlgebraISBN:9781305652231Author:R. David Gustafson, Jeff HughesPublisher:Cengage Learning
 Trigonometry (MindTap Course List)TrigonometryISBN:9781305652224Author:Charles P. McKeague, Mark D. TurnerPublisher:Cengage Learning
 Mathematics For Machine TechnologyAdvanced MathISBN:9781337798310Author:Peterson, John.Publisher:Cengage Learning,
 Algebra: Structure And Method, Book 1AlgebraISBN:9780395977224Author:Richard G. Brown, Mary P. Dolciani, Robert H. Sorgenfrey, William L. ColePublisher:McDougal Littell