
Applied Statistics in Business and Economics
5th Edition
ISBN: 9780077837303
Author: David Doane, Lori Seward Senior Instructor of Operations Management
Publisher: McGraw-Hill Education
expand_more
expand_more
format_list_bulleted
Concept explainers
Videos
Textbook Question
Chapter 13.1, Problem 1SE
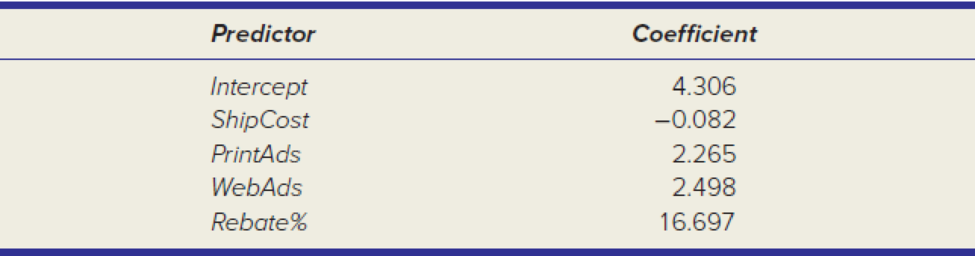
Observations are taken on net revenue from sales of a certain LCD TV at 50 retail outlets. The regression model was Y = net revenue (thousands of dollars), X1 = shipping cost (dollars per unit), X2 = expenditures on print advertising (thousands of dollars), X3 = expenditure on electronic media ads (thousands), X4 = rebate rate (percent of retail price). (a) Write the fitted regression equation. (b) Interpret each coefficient. (c) Would the intercept be likely to have meaning in this regression? (d) Use the fitted equation to make a prediction for NetRevenue when ShipCost = 10, PrintAds = 50, WebAds = 40, and Rebate% = 15.
Expert Solution & Answer
Want to see the full answer?
Check out a sample textbook solution
Students have asked these similar questions
65% of all violent felons in the prison system are repeat offenders. If 43 violent felons are randomly selected, find the probability that
a. Exactly 28 of them are repeat offenders.
b. At most 28 of them are repeat offenders. c. At least 28 of them are repeat offenders. d. Between 22 and 26 (including 22 and 26) of them are repeat offenders.
08:34
◄ Classroom
07:59
Probs. 5-32/33
D
ا.
89
5-34. Determine the horizontal and vertical components
of reaction at the pin A and the normal force at the smooth
peg B on the member.
A
0,4 m
0.4 m
Prob. 5-34
F=600 N
fr
th
ar
0.
163586
5-37. The wooden plank resting between the buildings
deflects slightly when it supports the 50-kg boy. This
deflection causes a triangular distribution of load at its ends.
having maximum intensities of w, and wg. Determine w
and wg. each measured in N/m. when the boy is standing
3 m from one end as shown. Neglect the mass of the plank.
0.45 m
3 m
Examine the Variables: Carefully review and note the names of all variables in the dataset. Examples of these variables include:
Mileage (mpg)
Number of Cylinders (cyl)
Displacement (disp)
Horsepower (hp)
Research: Google to understand these variables.
Statistical Analysis: Select mpg variable, and perform the following statistical tests. Once you are done with these tests using mpg variable, repeat the same with hp
Mean
Median
First Quartile (Q1)
Second Quartile (Q2)
Third Quartile (Q3)
Fourth Quartile (Q4)
10th Percentile
70th Percentile
Skewness
Kurtosis
Document Your Results:
In RStudio: Before running each statistical test, provide a heading in the format shown at the bottom. “# Mean of mileage – Your name’s command”
In Microsoft Word: Once you've completed all tests, take a screenshot of your results in RStudio and paste it into a Microsoft Word document. Make sure that snapshots are very clear. You will need multiple snapshots. Also transfer these results to the…
Chapter 13 Solutions
Applied Statistics in Business and Economics
Ch. 13.1 - Observations are taken on net revenue from sales...Ch. 13.1 - Observations are taken on sales of a certain...Ch. 13.1 - Prob. 3SECh. 13.1 - A regression model to predict Y, the...Ch. 13.2 - Refer to the ANOVA table below. (a) State the...Ch. 13.2 - Refer to the ANOVA table below. (a) State the...Ch. 13.2 - Prob. 7SECh. 13.2 - Refer to the ANOVA table below. (a) State the...Ch. 13.3 - Observations are taken on net revenue from sales...Ch. 13.3 - Observations are taken on sales of a certain...
Ch. 13.3 - Prob. 11SECh. 13.3 - A regression model to predict Y, the state...Ch. 13.4 - A regression of accountants starting salaries in a...Ch. 13.4 - An agribusiness performed a regression of wheat...Ch. 13.5 - Prob. 15SECh. 13.5 - A regression model to predict the price of...Ch. 13.5 - Prob. 17SECh. 13.5 - Prob. 18SECh. 13.6 - Prob. 19SECh. 13.6 - Prob. 20SECh. 13.7 - Prob. 21SECh. 13.7 - Using the Metals data, construct a correlation...Ch. 13.8 - Prob. 23SECh. 13.8 - Which violations of regression assumptions, if...Ch. 13 - (a) List two limitations of simple regression. (b)...Ch. 13 - (a) What does represent in the regression model?...Ch. 13 - Prob. 3CRCh. 13 - Prob. 4CRCh. 13 - Prob. 5CRCh. 13 - Prob. 6CRCh. 13 - Prob. 7CRCh. 13 - Prob. 8CRCh. 13 - Prob. 9CRCh. 13 - (a) State the formula for the standard error of...Ch. 13 - (a) What is a categorical predictor? (b) Why is a...Ch. 13 - Prob. 12CRCh. 13 - Prob. 13CRCh. 13 - (a) What is multicollinearity? (b) What are its...Ch. 13 - Prob. 15CRCh. 13 - (a) State the formula for a variance inflation...Ch. 13 - Prob. 17CRCh. 13 - Prob. 18CRCh. 13 - Prob. 19CRCh. 13 - Prob. 20CRCh. 13 - (a) Name two ways to detect autocorrelated...Ch. 13 - (a) What is a lurking variable? How might it be...Ch. 13 - Instructions for Data Sets: Choose one of the data...Ch. 13 - Note: Exercises marked are based on optional...Ch. 13 - Prob. 27CECh. 13 - Note: Exercises marked are based on optional...Ch. 13 - Note: Exercises marked are based on optional...Ch. 13 - Prob. 30CECh. 13 - Prob. 31CECh. 13 - Prob. 32CECh. 13 - Prob. 33CECh. 13 - Prob. 34CECh. 13 - Prob. 35CECh. 13 - Note: Exercises marked are based on optional...Ch. 13 - Note: Exercises marked are based on optional...Ch. 13 - Note: Exercises marked are based on optional...Ch. 13 - Prob. 39CECh. 13 - Prob. 40CECh. 13 - Prob. 41CECh. 13 - In a model of Fords quarterly revenue TotalRevenue...Ch. 13 - In a study of paint peel problems, a regression...Ch. 13 - A hospital emergency room analyzed n = 17,664...Ch. 13 - Prob. 45CECh. 13 - A researcher used stepwise regression to create...Ch. 13 - A sports enthusiast created an equation to predict...Ch. 13 - An expert witness in a case of alleged racial...Ch. 13 - Prob. 50CECh. 13 - Prob. 51CECh. 13 - Prob. 52CECh. 13 - Which statement is correct concerning one-factor...Ch. 13 - Prob. 2ERQCh. 13 - Prob. 3ERQCh. 13 - Prob. 4ERQCh. 13 - Prob. 5ERQCh. 13 - Prob. 6ERQCh. 13 - Prob. 7ERQCh. 13 - Prob. 8ERQCh. 13 - Prob. 9ERQCh. 13 - Prob. 10ERQCh. 13 - Prob. 11ERQCh. 13 - Prob. 12ERQCh. 13 - Prob. 13ERQCh. 13 - Prob. 14ERQCh. 13 - Prob. 15ERQ
Knowledge Booster


Learn more about
Need a deep-dive on the concept behind this application? Look no further. Learn more about this topic, statistics and related others by exploring similar questions and additional content below.Similar questions
- Examine the Variables: Carefully review and note the names of all variables in the dataset. Examples of these variables include: Mileage (mpg) Number of Cylinders (cyl) Displacement (disp) Horsepower (hp) Research: Google to understand these variables. Statistical Analysis: Select mpg variable, and perform the following statistical tests. Once you are done with these tests using mpg variable, repeat the same with hp Mean Median First Quartile (Q1) Second Quartile (Q2) Third Quartile (Q3) Fourth Quartile (Q4) 10th Percentile 70th Percentile Skewness Kurtosis Document Your Results: In RStudio: Before running each statistical test, provide a heading in the format shown at the bottom. “# Mean of mileage – Your name’s command” In Microsoft Word: Once you've completed all tests, take a screenshot of your results in RStudio and paste it into a Microsoft Word document. Make sure that snapshots are very clear. You will need multiple snapshots. Also transfer these results to the…arrow_forwardExamine the Variables: Carefully review and note the names of all variables in the dataset. Examples of these variables include: Mileage (mpg) Number of Cylinders (cyl) Displacement (disp) Horsepower (hp) Research: Google to understand these variables. Statistical Analysis: Select mpg variable, and perform the following statistical tests. Once you are done with these tests using mpg variable, repeat the same with hp Mean Median First Quartile (Q1) Second Quartile (Q2) Third Quartile (Q3) Fourth Quartile (Q4) 10th Percentile 70th Percentile Skewness Kurtosis Document Your Results: In RStudio: Before running each statistical test, provide a heading in the format shown at the bottom. “# Mean of mileage – Your name’s command” In Microsoft Word: Once you've completed all tests, take a screenshot of your results in RStudio and paste it into a Microsoft Word document. Make sure that snapshots are very clear. You will need multiple snapshots. Also transfer these results to the…arrow_forward2 (VaR and ES) Suppose X1 are independent. Prove that ~ Unif[-0.5, 0.5] and X2 VaRa (X1X2) < VaRa(X1) + VaRa (X2). ~ Unif[-0.5, 0.5]arrow_forward
- 8 (Correlation and Diversification) Assume we have two stocks, A and B, show that a particular combination of the two stocks produce a risk-free portfolio when the correlation between the return of A and B is -1.arrow_forward9 (Portfolio allocation) Suppose R₁ and R2 are returns of 2 assets and with expected return and variance respectively r₁ and 72 and variance-covariance σ2, 0%½ and σ12. Find −∞ ≤ w ≤ ∞ such that the portfolio wR₁ + (1 - w) R₂ has the smallest risk.arrow_forward7 (Multivariate random variable) Suppose X, €1, €2, €3 are IID N(0, 1) and Y2 Y₁ = 0.2 0.8X + €1, Y₂ = 0.3 +0.7X+ €2, Y3 = 0.2 + 0.9X + €3. = (In models like this, X is called the common factors of Y₁, Y₂, Y3.) Y = (Y1, Y2, Y3). (a) Find E(Y) and cov(Y). (b) What can you observe from cov(Y). Writearrow_forward
- 1 (VaR and ES) Suppose X ~ f(x) with 1+x, if 0> x > −1 f(x) = 1−x if 1 x > 0 Find VaRo.05 (X) and ES0.05 (X).arrow_forwardJoy is making Christmas gifts. She has 6 1/12 feet of yarn and will need 4 1/4 to complete our project. How much yarn will she have left over compute this solution in two different ways arrow_forwardSolve for X. Explain each step. 2^2x • 2^-4=8arrow_forward
- One hundred people were surveyed, and one question pertained to their educational background. The results of this question and their genders are given in the following table. Female (F) Male (F′) Total College degree (D) 30 20 50 No college degree (D′) 30 20 50 Total 60 40 100 If a person is selected at random from those surveyed, find the probability of each of the following events.1. The person is female or has a college degree. Answer: equation editor Equation Editor 2. The person is male or does not have a college degree. Answer: equation editor Equation Editor 3. The person is female or does not have a college degree.arrow_forwardneed help with part barrow_forwardSuppose you know that Bob's test score is above the mean, but he doesn't remember by how much. At least how many students must score lower than Bob?arrow_forward
arrow_back_ios
SEE MORE QUESTIONS
arrow_forward_ios
Recommended textbooks for you
 Glencoe Algebra 1, Student Edition, 9780079039897...AlgebraISBN:9780079039897Author:CarterPublisher:McGraw Hill
 Functions and Change: A Modeling Approach to Coll...AlgebraISBN:9781337111348Author:Bruce Crauder, Benny Evans, Alan NoellPublisher:Cengage Learning
 Big Ideas Math A Bridge To Success Algebra 1: Stu...AlgebraISBN:9781680331141Author:HOUGHTON MIFFLIN HARCOURTPublisher:Houghton Mifflin Harcourt
Glencoe Algebra 1, Student Edition, 9780079039897...
Algebra
ISBN:9780079039897
Author:Carter
Publisher:McGraw Hill
Functions and Change: A Modeling Approach to Coll...
Algebra
ISBN:9781337111348
Author:Bruce Crauder, Benny Evans, Alan Noell
Publisher:Cengage Learning
Big Ideas Math A Bridge To Success Algebra 1: Stu...
Algebra
ISBN:9781680331141
Author:HOUGHTON MIFFLIN HARCOURT
Publisher:Houghton Mifflin Harcourt
Correlation Vs Regression: Difference Between them with definition & Comparison Chart; Author: Key Differences;https://www.youtube.com/watch?v=Ou2QGSJVd0U;License: Standard YouTube License, CC-BY
Correlation and Regression: Concepts with Illustrative examples; Author: LEARN & APPLY : Lean and Six Sigma;https://www.youtube.com/watch?v=xTpHD5WLuoA;License: Standard YouTube License, CC-BY