Concept explainers
Videos
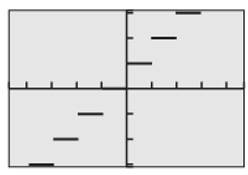
To match: the given graph with its function and verify with graphing window [−4.7,4.7]×[−3.1×3.1] .
The given graph matches with option (k) y=int(x+1) .
Given information: The given graph is,
Formula used:
The graph of the function y=f(x+h) is found by shifting the graph of the function y=f(x) by h units left.
Calculation:
See the shape of the graph.
The graph resembles to the graph of y=intx .
Consider the basic function y=intx .
Shift the graph 1 unit to left such that the x -intercept is 1 .
Thus, the graph of the function is y=int(x+1)
The given graph matches with option (k).
Graph the function in the graphing window [−4.7,4.7]×[−3.1×3.1], by using graphing calculator:
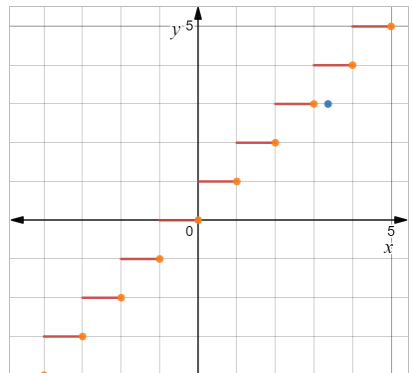
Hence, the graph matches with option (k) y=int(x+1) .
Chapter 1 Solutions
EBK PRECALCULUS:GRAPHICAL,...-NASTA ED.


- + Find the first five non-zero terms of the Taylor series for f(x) = sin(2x) centered at 4π. + + + ...arrow_forward+ + ... Find the first five non-zero terms of the Taylor series for f(x) centered at x = 4. = 1 x + + +arrow_forwardFind the interval and radius of convergence for the given power series. n=0 (− 1)" xn 7" (n² + 2) The series is convergent on the interval: The radius of convergence is R =arrow_forward
- Find the interval and radius of convergence for the given power series. n=1 (x-4)" n( - 8)" The series is convergent on the interval: The radius of convergence is R =arrow_forwardFind the interval and radius of convergence for the given power series. n=0 10"x" 7(n!) The series is convergent on the interval: The radius of convergence is R =arrow_forwardConsider the electrical circuit shown in Figure P6-41. It consists of two closed loops. Taking the indicated directions of the currents as positive, obtain the differential equations governing the currents I1 and I2 flowing through the resistor R and inductor L, respectively.arrow_forward
- Calculus lll May I please have the semicolon statements in the boxes explained and completed? Thank you so mucharrow_forwardCalculus lll May I please have the solution for the example? Thank youarrow_forward4. AP CalagaBourd Ten the g stem for 00 3B Quiz 3. The point P has polar coordinates (10, 5). Which of the following is the location of point P in rectangular coordinates? (A) (-5√3,5) (B) (-5,5√3) (C) (5√3,5) (D) (5√3,-5) 7A 6 2 3 4 S 元 3 داند 4/6 Polar axis -0 11 2 3 4 4 5л 3 Зл 2 11π 6 rectangular coordinates of K? The figure shows the polar coordinate system with point P labeled. Point P is rotated an angle of measure clockwise about the origin. The image of this transformation is at the location K (not shown). What are the (A) (-2,2√3) (B) (-2√3,2) (C) (2,-2√3) D) (2√3,-2) T 2arrow_forward
- AP CollegeBoard 3B Quiz 1. 2. y AP PRECALCULUS Name: od to dove (or) slog mig Test Boc 2л The figure gives the graphs of four functions labeled A, B, C, and D -1 in the xy-plane. Which is the graph of f(x) = 2 cos¹x ? m -3 π y 2- 1 3 (A) A (B) B 2 A B C D D -1- -2- Graph of f -2 -1 3. 2- y' Graph of g 1 2 1 3 y = R 2/01 y = 1 + 1/2 2 3 4 5 y= = 1-777 2 (C) C (D) D Which of the following defines g(x)? The figure gives the graphs of the functions ƒ and g in the xy-plane. The function f is given by f(x) = tan-1 EVES) (A) (A) tan¹x+1 (B) tan¹ x + 1/ (C) tan¹ (2) +1 (D) tan¹() + (B) Vs) a I.arrow_forwardConsider the region below f(x) = (11-x), above the x-axis, and between x = 0 and x = 11. Let x; be the midpoint of the ith subinterval. Complete parts a. and b. below. a. Approximate the area of the region using eleven rectangles. Use the midpoints of each subinterval for the heights of the rectangles. The area is approximately square units. (Type an integer or decimal.)arrow_forwardRama/Shutterstock.com Romaset/Shutterstock.com The power station has three different hydroelectric turbines, each with a known (and unique) power function that gives the amount of electric power generated as a function of the water flow arriving at the turbine. The incoming water can be apportioned in different volumes to each turbine, so the goal of this project is to determine how to distribute water among the turbines to give the maximum total energy production for any rate of flow. Using experimental evidence and Bernoulli's equation, the following quadratic models were determined for the power output of each turbine, along with the allowable flows of operation: 6 KW₁ = (-18.89 +0.1277Q1-4.08.10 Q) (170 - 1.6 · 10¯*Q) KW2 = (-24.51 +0.1358Q2-4.69-10 Q¹²) (170 — 1.6 · 10¯*Q) KW3 = (-27.02 +0.1380Q3 -3.84-10-5Q) (170 - 1.6-10-ºQ) where 250 Q1 <1110, 250 Q2 <1110, 250 <3 < 1225 Qi = flow through turbine i in cubic feet per second KW = power generated by turbine i in kilowattsarrow_forward
 Calculus: Early TranscendentalsCalculusISBN:9781285741550Author:James StewartPublisher:Cengage Learning
 Thomas' Calculus (14th Edition)CalculusISBN:9780134438986Author:Joel R. Hass, Christopher E. Heil, Maurice D. WeirPublisher:PEARSON
 Calculus: Early Transcendentals (3rd Edition)CalculusISBN:9780134763644Author:William L. Briggs, Lyle Cochran, Bernard Gillett, Eric SchulzPublisher:PEARSON
 Calculus: Early TranscendentalsCalculusISBN:9781319050740Author:Jon Rogawski, Colin Adams, Robert FranzosaPublisher:W. H. Freeman
 Calculus: Early Transcendental FunctionsCalculusISBN:9781337552516Author:Ron Larson, Bruce H. EdwardsPublisher:Cengage Learning