Concept explainers
a)
To find: The month in which both A and L bought the stock.
Both A and L bought the stock in March.
Given Information:
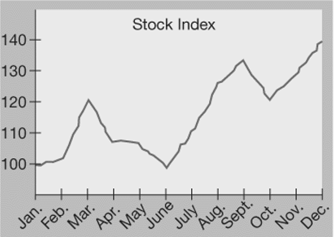
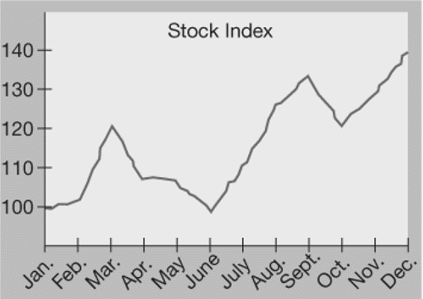
The graph shown in figure 1.

Figure 1
Explanation:
There is an increase in the price from
Therefore, both A and L would have bought the stock in March.
b)
To find: The approximate price at which A and L bought the stock.
Both A and L bought the stock at the price of
Given Information:
The graph shown in figure 1.

Figure 1
Explanation:
From the graph in figure 1, it follows that in March the stock price was
Therefore, both A and L bought the stock at the price of
c)
To find: When did A sell the stock.
A sold the stock in June.
Given Information:
According the A’s rule, if the stock doesn’t perform well for consecutive three months, then the person will sell the stock.
Explanation:
From the graph, it follows that from March, the prices of the stock fell continuously for three months.
Therefore, A sold the stock in June.
d)
To find: How much A loses on the stock.
A lose
Given Information:
A bought 100 shares at the price
Explanation:
A sold the shares at
A bought 100 shares at the price
The amount he lost is
Therefore, A’s total loss is
e)
To explain: Why Person L’s strategy was better for this particular stock and year over Person A’s strategy.
Given Information:
The graph shown in figure 1. Also, according the A’s rule, if the stock doesn’t perform well for consecutive three months, then the Person A will sell the stock, and according to Person L’s rule if the stock doesn’t perform well since its purchase, then Person L will sell the stock in December.
Explanation:
A sold his stock in March and since then the price of the stock is started rising again. At the end of the year, it rises to
Now, L sold her stock at the end of the year.
So, she got
She invested
Thus, she earned a profit of
Since L earned a profit of
f)
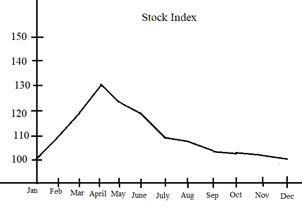
To sketch: A 12-month graph of a stock’s performance that would favor A’s strategy over L’s.
Given Information:
According the A’s rule, if the stock doesn’t perform well for consecutive three months, then the Person A will sell the stock, and according to Person L’s rule if the stock has failed to perform well since its purchase, then Person L will sell the stock in December.
Graph:
Person A’s strategy would be favoured if any graph decrease steadily from March to December.
The graph in figure 2 shows that A’s strategy is better than L’s.

Figure 2
In this case, L sold her stock at the end of the year.
So, she got
A sold his stock in July at
Thus, A earned more than L.
Chapter 1 Solutions
EBK PRECALCULUS:GRAPHICAL,...-NASTA ED.
- Find the tangent line approximation 7 to the graph of f at the given point. T(x) = f(x) = csc(x), (8, csc(8)) Complete the table. (Round your answers to four decimal places.) x f(x) T(x) 7.9 7.99 8 8.01 8.1arrow_forwardCan you solve it numerical methodarrow_forwardUse the information to find and compare Ay and dy. (Round your answers to four decimal places.) Function x-Value Differential of x Ду = dy = y = x² + 2 x = -4 Ax = dx = 0.01arrow_forward
- Calculus lll May I please have the statements with blank lines completed; furthermore, may I please have the text box completed? Thank youarrow_forwardCalculus lll May I please have the statements completed for the following text lines and box? Thank you so much,arrow_forwardCalculus lll May I please have the solution for the following exercise? Thank you so mucharrow_forward
- Calculus lll May I please have the statement completed for the following box? Thank you so much,arrow_forwardCalculus lll May I please have the solution for the following exercise? Thank you so mucharrow_forwardUse a graphing calculator to find where the curves intersect and to find the area between the curves. y=ex, y=-x²-4x a. The left point of intersection is (Type integers or decimals rounded to the nearest thousandth as needed. Type an ordered pair.)arrow_forward
 Calculus: Early TranscendentalsCalculusISBN:9781285741550Author:James StewartPublisher:Cengage Learning
 Thomas' Calculus (14th Edition)CalculusISBN:9780134438986Author:Joel R. Hass, Christopher E. Heil, Maurice D. WeirPublisher:PEARSON
 Calculus: Early Transcendentals (3rd Edition)CalculusISBN:9780134763644Author:William L. Briggs, Lyle Cochran, Bernard Gillett, Eric SchulzPublisher:PEARSON
 Calculus: Early TranscendentalsCalculusISBN:9781319050740Author:Jon Rogawski, Colin Adams, Robert FranzosaPublisher:W. H. Freeman
 Calculus: Early Transcendental FunctionsCalculusISBN:9781337552516Author:Ron Larson, Bruce H. EdwardsPublisher:Cengage Learning


