Concept explainers
Videos
(a)
To find: the function is continuous on the given interval and the maximum and minimum values of the function.
The
The maximum value is
The minimum value is
Given information:
The function
Calculation:
The graph of the given function on the interval is displayed below.
Ensure that the right end of the graph contacts the right side of the screen and that the left end touches the left.
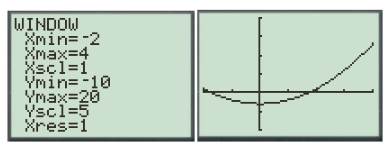
Confirmed,
Determine the graph's maximum and minimum points and their values using the maximum and minimum features:
The maximum value is 1 which occurs at
The minimum value is
Using a graphing calculator,
The maximum value is
The minimum value is
(b)
To find: the function is continuous on the given interval and the maximum and minimum values of the function.
The function
The maximum value is 1 which occurs at
The minimum value is
Given information:
The function
Calculation:
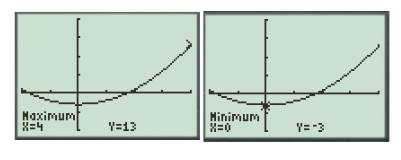
The graph of the given function on the interval is displayed below.
Ensure that the right end of the graph contacts the right side of the screen and that the left end touches the left.
Confirmed,
Determine the graph's maximum and minimum points and their values using the maximum and minimum features:
The maximum value is 1 which occurs at
Using a graphing calculator,
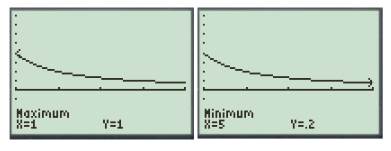
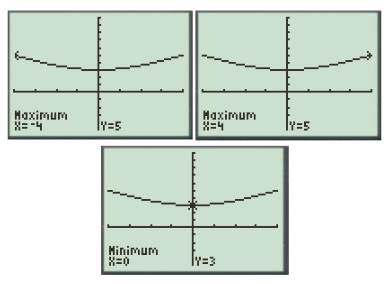
(c)
To find: the function is continuous on the given interval and the maximum and minimum values of the function.
The function
The maximum value is 5 which occurs at
The minimum value is 2 which occurs at
Given information:
The function
Calculation:
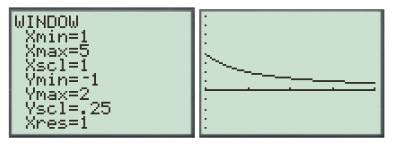
The graph of the given function on the interval is displayed below.
Ensure that the right end of the graph contacts the right side of the screen and that the left end touches the left.
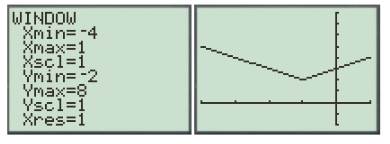
Confirmed,
Determine the graph's maximum and minimum points and their values using the maximum and minimum features:
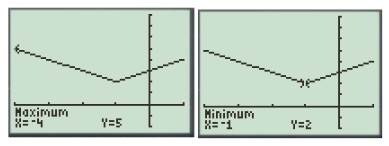
The maximum value is 1 which occurs at
(d)
To find: the function is continuous on the given interval and the maximum and minimum values of the function.
The function
The maximum value is
The minimum value is 3 which occurs at
Given information:
The function
Calculation:
The graph of the given function on the interval is displayed below.
Ensure that the right end of the graph contacts the right side of the screen and that the left end touches the left.
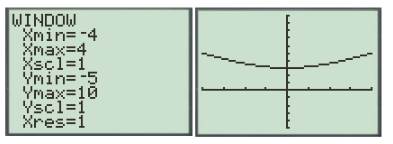
Confirmed,
Determine the graph's maximum and minimum points and their values using the maximum and minimum features:
The maximum value is
Using a graphing calculator,
The minimum value is 3 which occurs at
Chapter 1 Solutions
EBK PRECALCULUS:GRAPHICAL,...-NASTA ED.


- #3 Find the derivative y' = of the following functions, using the derivative rules: dx a) y-Cos 6x b) y=x-Sin4x c) y=x-Cos3x d) y=x-R CD-X:-:TCH :D:D:D - Sin f) Sin(x²) (9) Tan (x³)arrow_forwardmate hat is the largest area that can be en 18 For the function y=x³-3x² - 1, use derivatives to: (a) determine the intervals of increase and decrease. (b) determine the local (relative) maxima and minima. (c) determine the intervals of concavity. (d) determine the points of inflection. b) (e) sketch the graph with the above information indicated on the graph.arrow_forwarduse L'Hopital Rule to evaluate the following. a) 4x3 +10x2 23009׳-9 943-9 b) hm 3-84 хто бу+2 < xan x-30650)arrow_forward
- Evaluate the next integralarrow_forward1. For each of the following, find the critical numbers of f, the intervals on which f is increasing or decreasing, and the relative maximum and minimum values of f. (a) f(x) = x² - 2x²+3 (b) f(x) = (x+1)5-5x-2 (c) f(x) = x2 x-9 2. For each of the following, find the intervals on which f is concave upward or downward and the inflection points of f. (a) f(x) = x - 2x²+3 (b) g(x) = x³- x (c) f(x)=x-6x3 + x-8 3. Find the relative maximum and minimum values of the following functions by using the Second Derivative Test. (a) f(x)=1+3x² - 2x3 (b) g(x) = 2x3 + 3x² - 12x-4arrow_forwardFind the Soultion to the following dy differential equation using Fourier in transforms: = , хуо, ухо according to the terms: lim u(x,y) = 0 x18 lim 4x (x,y) = 0 x14 2 u (x, 0) = =\u(o,y) = -y لوarrow_forward
- Can you solve question 3,4,5 and 6 for this questionarrow_forwardwater at a rate of 2 m³/min. of the water height in this tank? 16) A box with a square base and an open top must have a volume of 256 cubic inches. Find the dimensions of the box that will minimize the amount of material used (the surface area). 17) A farmer wishes toarrow_forward#14 Sand pours from a chute and forms a conical pile whose height is always equal to its base diameter. The height o the pile increases at a rate of 5 feet/hour. Find the rate of change of the volume of the sand in the conical pile when the height of the pile is 4 feet.arrow_forward
- (d)(65in(x)-5 cos(x) dx mins by 5x-2x² 3x+1 dx -dx 20 Evaluate each the following indefinite integralsarrow_forward19 Evaluate each the following definite integrals: a) લ b) (+3) 6) (2-2)(+33) dxarrow_forward#11 If a snowball melts so its surface area decreases at a rate of 1cm²/min, find the rate at which the diameter decreases when the diameter is 6 cm.arrow_forward
 Calculus: Early TranscendentalsCalculusISBN:9781285741550Author:James StewartPublisher:Cengage Learning
 Thomas' Calculus (14th Edition)CalculusISBN:9780134438986Author:Joel R. Hass, Christopher E. Heil, Maurice D. WeirPublisher:PEARSON
 Calculus: Early Transcendentals (3rd Edition)CalculusISBN:9780134763644Author:William L. Briggs, Lyle Cochran, Bernard Gillett, Eric SchulzPublisher:PEARSON
 Calculus: Early TranscendentalsCalculusISBN:9781319050740Author:Jon Rogawski, Colin Adams, Robert FranzosaPublisher:W. H. Freeman
 Calculus: Early Transcendental FunctionsCalculusISBN:9781337552516Author:Ron Larson, Bruce H. EdwardsPublisher:Cengage Learning