
Videos
Curing concrete is known to be vulnerable to shock vibrations, which may cause cracking or hidden damage to the material. As part of a study of vibration phenomena, the paper “Shock Vibration Test of Concrete” (ACI Materials J., 2002: 361–370) reported the accompanying data on peak particle velocity (mm/sec) and ratio of ultrasonic pulse velocity after impact to that before impact in concrete prisms.
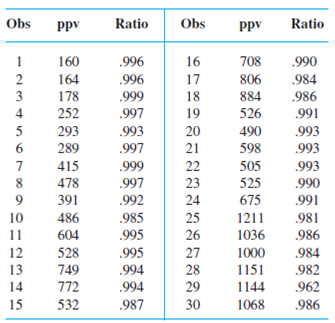
Transverse cracks appeared in the last 12 prisms, whereas there was no observed cracking in the first 18 prisms.
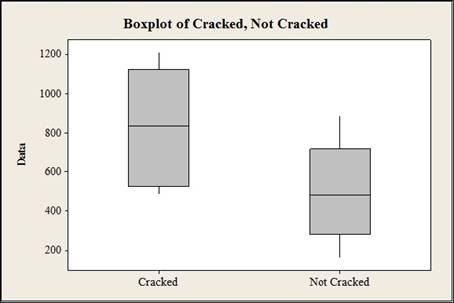
a. Construct a comparative boxplot of ppv for the cracked and uncracked prisms and comment. Then estimate the difference between true average ppv for cracked and uncracked prisms in a way that conveys information about precision and reliability.
b. The investigators fit the simple linear regression model to the entire data set consisting of 30 observations, with ppv as the independent variable and ratio as the dependent variable. Use a statistical software package to fit several different regression models, and draw appropriate inferences.
a.
Construct a comparative boxplot for the given data.
Answer to Problem 65SE
The comparative boxplot is given below:
Explanation of Solution
Given info:
The data shows the ultra sonic pulse velocity ratio before and after impact in concrete prisms for peak velocity. The first 18 observations shows the values before cracking and last 12 observations shows the values after cracking.
Calculation:
Comparative boxplot:
Software procedure:
Step by step procedure to construct the boxplot is given below:
- Choose Graph > Boxplot.
- Under Multiple Y's, choose Simple. Click OK.
- In Graph variables, enter the data of cracked and not cracked.
- Click OK.
Interpretation:
Thus, the box plot is constructed for the cracked ratio and not cracked ratio and the box plot suggests that the ultra sonic pulse velocity ratio for cracked ppv is greater than the ratio of not cracked ppv.
b.
Fit several different regression models and draw conclusions.
Answer to Problem 65SE
The simple linear regression model is given below:
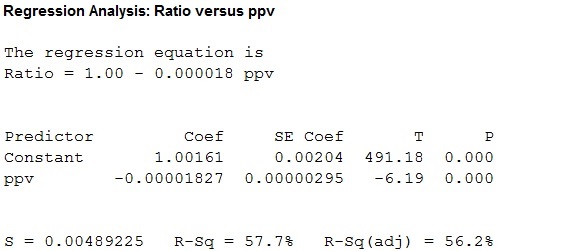
Figure 2
The multiple linear regression model is given below:
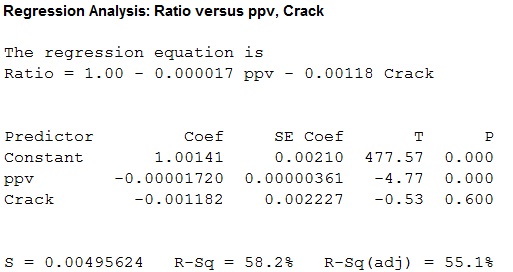
Figure 2
The multiple linear regression model with interaction is given below:
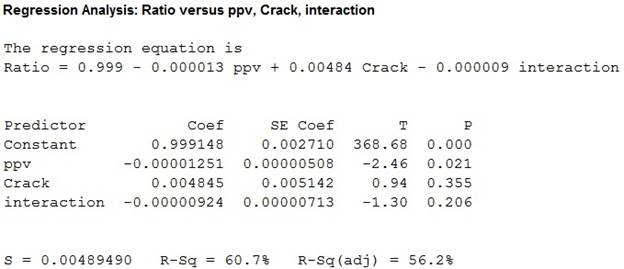
Figure 3
Explanation of Solution
Calculation:
Simple linear regression:
Software procedure:
Step by step procedure to fit a simple linear regression model is given below:
- Click Stat>Regression>Regression.
- Under Response (Y) select the column containing ratio.
- Under Predictor (X) select the column containing ppv.
- Click OK.
Interpretation:
Thus, a simple regression is fitted for the given data, the value of coefficient of determination is 57.7 which tells that the peak particle velocity can explain 57.7% of the variation in ratio of ultrasonic pulse velocity.
Multiple regression model with indicator variable (crack):
The new indicator variable is created by coding the observations with crack as 1 and observations without a crack as 0. Then the multiple regression model is built.
Software procedure:
Step by step procedure to fit a simple linear regression model is given below:
- Click Stat>Regression>Regression.
- Under Response (Y) select the column containing ratio.
- Under Predictor (X) select the column containing ppv, crack.
- Click OK.
Interpretation:
Thus, a multiple regression model is fitted for the given data , the value of coefficient of determination is 58.2 which tells that the peak particle velocity and crack can explain 58.2% of the variation in ratio of ultrasonic pulse velocity.
Multiple regression model with interaction between ppv and indicator variable (crack):
The indication variable is created by multiplying the ppv with indicator variable.
Software procedure:
Step by step procedure to fit a simple linear regression model is given below:
- Click Stat>Regression>Regression.
- Under Response (Y) select the column containing ratio.
- Under Predictor (X) select the column containing ppv, crack and interaction.
- Click OK.
Interpretation:
Thus, a multiple regression model with interaction between crack and ppv is fitted for the given data , the value of coefficient of determination is 60.7 which tells that the peak particle velocity, crack and interaction can explain 60.7% of the variation in ratio of ultrasonic pulse velocity.
The P- value for the individual t statistic corresponding to ppv and interaction are 0.355 and 0.206 which greater than the 5% level of significance.
Conclusion:
The simple linear, multiple linear model and multiple linear model with interaction gives almost the same
Want to see more full solutions like this?
Chapter 13 Solutions
Probability and Statistics for Engineering and the Sciences STAT 400 - University Of Maryland


- 9. The concentration function of a random variable X is defined as Qx(h) = sup P(x ≤ X ≤x+h), h>0. Show that, if X and Y are independent random variables, then Qx+y (h) min{Qx(h). Qr (h)).arrow_forward10. Prove that, if (t)=1+0(12) as asf->> O is a characteristic function, then p = 1.arrow_forward9. The concentration function of a random variable X is defined as Qx(h) sup P(x ≤x≤x+h), h>0. (b) Is it true that Qx(ah) =aQx (h)?arrow_forward
- 3. Let X1, X2,..., X, be independent, Exp(1)-distributed random variables, and set V₁₁ = max Xk and W₁ = X₁+x+x+ Isk≤narrow_forward7. Consider the function (t)=(1+|t|)e, ER. (a) Prove that is a characteristic function. (b) Prove that the corresponding distribution is absolutely continuous. (c) Prove, departing from itself, that the distribution has finite mean and variance. (d) Prove, without computation, that the mean equals 0. (e) Compute the density.arrow_forward1. Show, by using characteristic, or moment generating functions, that if fx(x) = ½ex, -∞0 < x < ∞, then XY₁ - Y2, where Y₁ and Y2 are independent, exponentially distributed random variables.arrow_forward
- 1. Show, by using characteristic, or moment generating functions, that if 1 fx(x): x) = ½exarrow_forward1990) 02-02 50% mesob berceus +7 What's the probability of getting more than 1 head on 10 flips of a fair coin?arrow_forward9. The concentration function of a random variable X is defined as Qx(h) sup P(x≤x≤x+h), h>0. = x (a) Show that Qx+b(h) = Qx(h).arrow_forward
- Suppose that you buy a lottery ticket, and you have to pick six numbers from 1 through 50 (repetitions allowed). Which combination is more likely to win: 13, 48, 17, 22, 6, 39 or 1, 2, 3, 4, 5, 6? barrow_forward2 Make a histogram from this data set of test scores: 72, 79, 81, 80, 63, 62, 89, 99, 50, 78, 87, 97, 55, 69, 97, 87, 88, 99, 76, 78, 65, 77, 88, 90, and 81. Would a pie chart be appropriate for this data? ganizing Quantitative Data: Charts and Graphs 45arrow_forward10 Meteorologists use computer models to predict when and where a hurricane will hit shore. Suppose they predict that hurricane Stat has a 20 percent chance of hitting the East Coast. a. On what info are the meteorologists basing this prediction? b. Why is this prediction harder to make than your chance of getting a head on your next coin toss? U anoiaarrow_forward
 MATLAB: An Introduction with ApplicationsStatisticsISBN:9781119256830Author:Amos GilatPublisher:John Wiley & Sons Inc
 Probability and Statistics for Engineering and th...StatisticsISBN:9781305251809Author:Jay L. DevorePublisher:Cengage Learning
 Statistics for The Behavioral Sciences (MindTap C...StatisticsISBN:9781305504912Author:Frederick J Gravetter, Larry B. WallnauPublisher:Cengage Learning
 Elementary Statistics: Picturing the World (7th E...StatisticsISBN:9780134683416Author:Ron Larson, Betsy FarberPublisher:PEARSON
 The Basic Practice of StatisticsStatisticsISBN:9781319042578Author:David S. Moore, William I. Notz, Michael A. FlignerPublisher:W. H. Freeman
 Introduction to the Practice of StatisticsStatisticsISBN:9781319013387Author:David S. Moore, George P. McCabe, Bruce A. CraigPublisher:W. H. Freeman