
Concept explainers
Videos
a.
Find the
Check whether the correlation coefficient is greater than zero.
a.
Answer to Problem 56CE
The
There is not enough evidence to infer that the population correlation is positive.
Explanation of Solution
Step-by-step procedure to obtain the correlation coefficient using MegaStat software:
- In an EXCEL sheet enter the data values of x and y.
- Go to Add-Ins > MegaStat > Correlation/Regression > Correlation matrix.
- Enter Input
Range as Sheet6!$H$1:$I$9. - Click on OK.
Output obtained using MegaStat is given as follows:
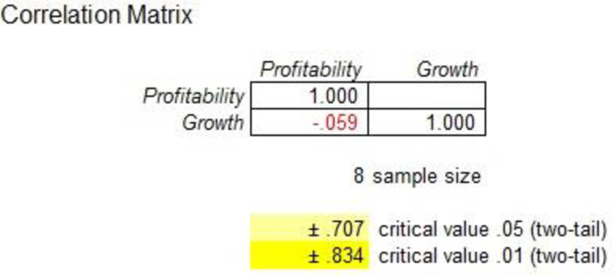
The correlation coefficient is –0.059.
Denote the population correlation as
The hypotheses are given below:
Null hypothesis:
That is, the correlation in the population is less than or equal to zero.
Alternative hypothesis:
That is, the correlation in the population is positive.
Test statistic:
The test statistic is as follows:
Here, the
The test statistic is as follows:
Degrees of freedom:
The level of significance is 0.05. Therefore,
Critical value:
Step-by-step software procedure to obtain the critical value using EXCEL software:
- Open an EXCEL file.
- In cell A1, enter the formula “=T.INV (0.95, 6)”.
Output obtained using the EXCEL is given as follows:

Decision rule:
Reject the null hypothesis H0, if
Otherwise, fail to reject H0.
Conclusion:
The value of test statistic is –0.415 and the critical value is 1.943.
Here,
By the rejection rule, do not reject the null hypothesis.
Thus, there is not enough evidence to infer that the population correlation is positive.
b.
Find the regression equation and check whether it can be concluded that the slope of the regression line is negative.
b.
Answer to Problem 56CE
The regression equation is
There is sufficient evidence to conclude that the slope of the regression line is not negative at 5% level of significance.
Explanation of Solution
Step-by-step procedure to obtain the ‘Regression equation’ using the MegaStat software:
- In an EXCEL sheet enter the data values of x and y.
- Go to Add-Ins > MegaStat > Correlation/Regression >
Regression Analysis . - Select input range as ‘Sheet6!$I$1:$I$9’ under Y/Dependent variable.
- Select input range ‘Sheet6!$H$1:$H$9’ under X/Independent variables.
- Click on OK.
Output using the Mega Stat software is given below:
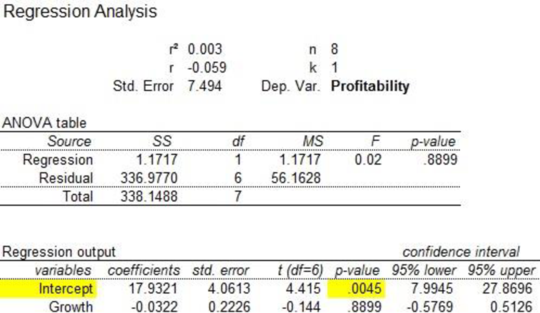
From the output, the regression equation is,
The test hypotheses are:
Define
Null hypothesis:
That is, the slope of the regression line is not less than zero.
Alternate hypothesis:
That is, the slope of the regression line is less than zero.
Consider the level of significance as 0.05.
The standard error of
Test statistic:
The t-test statistic is:
Where,
Thus,
Here, the sample size is
Step-by-step software procedure to obtain the critical value,
• Open an EXCEL file.
• In cell A1, enter the formula “=T.INV(0.95,6)”.
Output using the EXCEL is given as follows:
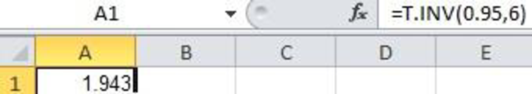
From the EXCEL output, the critical value is 1.943.
Decision based on critical value:
Reject the null hypothesis if,
Otherwise fail to reject H0.
Conclusion:
The t-calculated value is –0.144 and the critical value is 1.943.
That is,
Thus, the null hypothesis is not rejected.
Hence, there is sufficient evidence to conclude that the slope of the regression line is not negative at 5% level of significance.
c.
Find the residual for each observation and find the company that has the largest residual.
c.
Answer to Problem 56CE
Company RC has the largest residual.
Explanation of Solution
The error estimate is the difference between actual return and estimated return. The error estimates for each of the companies are as follows:
| Company | y | y-cap | Error |
| AT | 23.1 | 17.6745 | 5.4255 |
| B | 13.2 | 17.42978 | –4.22978 |
| GD | 24.2 | 16.92746 | 7.27254 |
| H | 11.1 | 17.8516 | –6.7516 |
| LC | 10.1 | 16.79222 | –6.69222 |
| NG | 10.8 | 17.7389 | –6.9389 |
| RC | 27.3 | 17.65196 | 9.64804 |
| UT | 20.1 | 17.82906 | 2.27094 |
From the table, it is clear that company RC has the largest residual.
Want to see more full solutions like this?
Chapter 13 Solutions
Gen Combo Ll Statistical Techniques In Business And Economics; Connect Ac


- Harvard University California Institute of Technology Massachusetts Institute of Technology Stanford University Princeton University University of Cambridge University of Oxford University of California, Berkeley Imperial College London Yale University University of California, Los Angeles University of Chicago Johns Hopkins University Cornell University ETH Zurich University of Michigan University of Toronto Columbia University University of Pennsylvania Carnegie Mellon University University of Hong Kong University College London University of Washington Duke University Northwestern University University of Tokyo Georgia Institute of Technology Pohang University of Science and Technology University of California, Santa Barbara University of British Columbia University of North Carolina at Chapel Hill University of California, San Diego University of Illinois at Urbana-Champaign National University of Singapore McGill…arrow_forwardName Harvard University California Institute of Technology Massachusetts Institute of Technology Stanford University Princeton University University of Cambridge University of Oxford University of California, Berkeley Imperial College London Yale University University of California, Los Angeles University of Chicago Johns Hopkins University Cornell University ETH Zurich University of Michigan University of Toronto Columbia University University of Pennsylvania Carnegie Mellon University University of Hong Kong University College London University of Washington Duke University Northwestern University University of Tokyo Georgia Institute of Technology Pohang University of Science and Technology University of California, Santa Barbara University of British Columbia University of North Carolina at Chapel Hill University of California, San Diego University of Illinois at Urbana-Champaign National University of Singapore…arrow_forwardA company found that the daily sales revenue of its flagship product follows a normal distribution with a mean of $4500 and a standard deviation of $450. The company defines a "high-sales day" that is, any day with sales exceeding $4800. please provide a step by step on how to get the answers in excel Q: What percentage of days can the company expect to have "high-sales days" or sales greater than $4800? Q: What is the sales revenue threshold for the bottom 10% of days? (please note that 10% refers to the probability/area under bell curve towards the lower tail of bell curve) Provide answers in the yellow cellsarrow_forward
- Find the critical value for a left-tailed test using the F distribution with a 0.025, degrees of freedom in the numerator=12, and degrees of freedom in the denominator = 50. A portion of the table of critical values of the F-distribution is provided. Click the icon to view the partial table of critical values of the F-distribution. What is the critical value? (Round to two decimal places as needed.)arrow_forwardA retail store manager claims that the average daily sales of the store are $1,500. You aim to test whether the actual average daily sales differ significantly from this claimed value. You can provide your answer by inserting a text box and the answer must include: Null hypothesis, Alternative hypothesis, Show answer (output table/summary table), and Conclusion based on the P value. Showing the calculation is a must. If calculation is missing,so please provide a step by step on the answers Numerical answers in the yellow cellsarrow_forwardShow all workarrow_forward
 Glencoe Algebra 1, Student Edition, 9780079039897...AlgebraISBN:9780079039897Author:CarterPublisher:McGraw Hill
 Functions and Change: A Modeling Approach to Coll...AlgebraISBN:9781337111348Author:Bruce Crauder, Benny Evans, Alan NoellPublisher:Cengage Learning
 Big Ideas Math A Bridge To Success Algebra 1: Stu...AlgebraISBN:9781680331141Author:HOUGHTON MIFFLIN HARCOURTPublisher:Houghton Mifflin Harcourt
 College AlgebraAlgebraISBN:9781305115545Author:James Stewart, Lothar Redlin, Saleem WatsonPublisher:Cengage Learning
 Holt Mcdougal Larson Pre-algebra: Student Edition...AlgebraISBN:9780547587776Author:HOLT MCDOUGALPublisher:HOLT MCDOUGAL