
Gen Combo Ll Statistical Techniques In Business And Economics; Connect Ac
17th Edition
ISBN: 9781260149623
Author: Lind
Publisher: MCG
expand_more
expand_more
format_list_bulleted
Concept explainers
Videos
Textbook Question
Chapter 13, Problem 3E
Bi-lo Appliance Super-Store has outlets in several large metropolitan areas in New England. The general sales manager aired a commercial for a digital camera on selected local TV stations prior to a sale starting on Saturday and ending Sunday. She obtained the information for Saturday–Sunday digital camera sales at the various outlets and paired it with the number of times the advertisement was shown on the local TV stations. The purpose is to find whether there is any relationship between the number of times the advertisement was aired and digital camera sales. The pairings are:
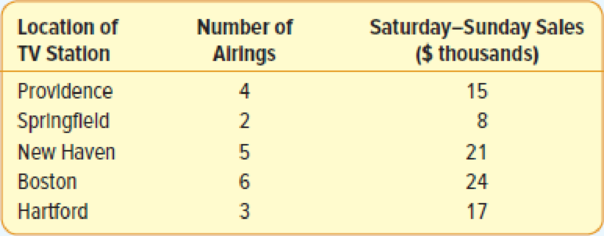
- a. What is the dependent variable?
- b. Draw a
scatter diagram . - c. Determine the
correlation coefficient . - d. Interpret these statistical measures.
Expert Solution & Answer
Want to see the full answer?
Check out a sample textbook solution
Students have asked these similar questions
Business
https://www.hawkeslearning.com/Statistics/dbs2/datasets.html
NC Current Students - North Ce X | NC Canvas Login Links - North ( X
Final Exam Comprehensive x Cengage Learning
x
WASTAT - Final Exam - STAT
→
C
webassign.net/web/Student/Assignment-Responses/submit?dep=36055360&tags=autosave#question3659890_9
Part (b)
Draw a scatter plot of the ordered pairs.
N
Life
Expectancy
Life
Expectancy
80
70
600
50
40
30
20
10
Year of
1950
1970 1990
2010 Birth
O
Life
Expectancy
Part (c)
800
70
60
50
40
30
20
10
1950
1970 1990
W
ALT
林
$
#
4
R
J7
Year of
2010 Birth
F6
4+
80
70
60
50
40
30
20
10
Year of
1950 1970 1990
2010 Birth
Life
Expectancy
Ox
800
70
60
50
40
30
20
10
Year of
1950 1970 1990 2010 Birth
hp
P.B.
KA
&
7
80
% 5
H
A
B
F10
711
N
M
K
744
PRT SC
ALT
CTRL
Chapter 13 Solutions
Gen Combo Ll Statistical Techniques In Business And Economics; Connect Ac
Ch. 13 - Prob. 1SRCh. 13 - Prob. 1ECh. 13 - Prob. 2ECh. 13 - Bi-lo Appliance Super-Store has outlets in several...Ch. 13 - Prob. 4ECh. 13 - Prob. 5ECh. 13 - The owner of Maumee Ford-Volvo wants to study the...Ch. 13 - Prob. 2SRCh. 13 - Prob. 7ECh. 13 - Prob. 8E
Ch. 13 - Prob. 9ECh. 13 - Prob. 10ECh. 13 - Prob. 11ECh. 13 - Prob. 12ECh. 13 - Prob. 3SRCh. 13 - Prob. 13ECh. 13 - Prob. 14ECh. 13 - Prob. 15ECh. 13 - Prob. 16ECh. 13 - Prob. 17ECh. 13 - Prob. 18ECh. 13 - Prob. 19ECh. 13 - Prob. 20ECh. 13 - Prob. 4SRCh. 13 - Prob. 21ECh. 13 - Prob. 22ECh. 13 - Prob. 23ECh. 13 - Prob. 24ECh. 13 - Prob. 5SRCh. 13 - Prob. 25ECh. 13 - Prob. 26ECh. 13 - Prob. 27ECh. 13 - Prob. 28ECh. 13 - Prob. 29ECh. 13 - Prob. 30ECh. 13 - Prob. 6SRCh. 13 - Prob. 31ECh. 13 - Prob. 32ECh. 13 - Prob. 33ECh. 13 - Refer to Exercise 16. a. Determine the .95...Ch. 13 - Prob. 35ECh. 13 - Prob. 36ECh. 13 - A regional commuter airline selected a random...Ch. 13 - Prob. 38CECh. 13 - Prob. 39CECh. 13 - Prob. 40CECh. 13 - Prob. 41CECh. 13 - Prob. 42CECh. 13 - Prob. 43CECh. 13 - Prob. 44CECh. 13 - The manufacturer of Cardio Glide exercise...Ch. 13 - Prob. 46CECh. 13 - Prob. 47CECh. 13 - Prob. 48CECh. 13 - Prob. 49CECh. 13 - Mr. William Profit is studying companies going...Ch. 13 - Prob. 51CECh. 13 - Prob. 52CECh. 13 - Prob. 53CECh. 13 - Prob. 54CECh. 13 - A regression analysis relating the current market...Ch. 13 - Prob. 56CECh. 13 - Prob. 57CECh. 13 - A consumer buying cooperative tested the effective...Ch. 13 - Prob. 59CECh. 13 - Prob. 60CECh. 13 - TravelAir.com samples domestic airline flights to...Ch. 13 - The North Valley Real Estate data reports...Ch. 13 - Prob. 64DA
Knowledge Booster


Learn more about
Need a deep-dive on the concept behind this application? Look no further. Learn more about this topic, statistics and related others by exploring similar questions and additional content below.Similar questions
- Harvard University California Institute of Technology Massachusetts Institute of Technology Stanford University Princeton University University of Cambridge University of Oxford University of California, Berkeley Imperial College London Yale University University of California, Los Angeles University of Chicago Johns Hopkins University Cornell University ETH Zurich University of Michigan University of Toronto Columbia University University of Pennsylvania Carnegie Mellon University University of Hong Kong University College London University of Washington Duke University Northwestern University University of Tokyo Georgia Institute of Technology Pohang University of Science and Technology University of California, Santa Barbara University of British Columbia University of North Carolina at Chapel Hill University of California, San Diego University of Illinois at Urbana-Champaign National University of Singapore McGill…arrow_forwardName Harvard University California Institute of Technology Massachusetts Institute of Technology Stanford University Princeton University University of Cambridge University of Oxford University of California, Berkeley Imperial College London Yale University University of California, Los Angeles University of Chicago Johns Hopkins University Cornell University ETH Zurich University of Michigan University of Toronto Columbia University University of Pennsylvania Carnegie Mellon University University of Hong Kong University College London University of Washington Duke University Northwestern University University of Tokyo Georgia Institute of Technology Pohang University of Science and Technology University of California, Santa Barbara University of British Columbia University of North Carolina at Chapel Hill University of California, San Diego University of Illinois at Urbana-Champaign National University of Singapore…arrow_forwardA company found that the daily sales revenue of its flagship product follows a normal distribution with a mean of $4500 and a standard deviation of $450. The company defines a "high-sales day" that is, any day with sales exceeding $4800. please provide a step by step on how to get the answers in excel Q: What percentage of days can the company expect to have "high-sales days" or sales greater than $4800? Q: What is the sales revenue threshold for the bottom 10% of days? (please note that 10% refers to the probability/area under bell curve towards the lower tail of bell curve) Provide answers in the yellow cellsarrow_forward
- Find the critical value for a left-tailed test using the F distribution with a 0.025, degrees of freedom in the numerator=12, and degrees of freedom in the denominator = 50. A portion of the table of critical values of the F-distribution is provided. Click the icon to view the partial table of critical values of the F-distribution. What is the critical value? (Round to two decimal places as needed.)arrow_forwardA retail store manager claims that the average daily sales of the store are $1,500. You aim to test whether the actual average daily sales differ significantly from this claimed value. You can provide your answer by inserting a text box and the answer must include: Null hypothesis, Alternative hypothesis, Show answer (output table/summary table), and Conclusion based on the P value. Showing the calculation is a must. If calculation is missing,so please provide a step by step on the answers Numerical answers in the yellow cellsarrow_forwardShow all workarrow_forward
arrow_back_ios
SEE MORE QUESTIONS
arrow_forward_ios
Recommended textbooks for you
 Glencoe Algebra 1, Student Edition, 9780079039897...AlgebraISBN:9780079039897Author:CarterPublisher:McGraw Hill
 Holt Mcdougal Larson Pre-algebra: Student Edition...AlgebraISBN:9780547587776Author:HOLT MCDOUGALPublisher:HOLT MCDOUGAL
 College Algebra (MindTap Course List)AlgebraISBN:9781305652231Author:R. David Gustafson, Jeff HughesPublisher:Cengage Learning
 Algebra: Structure And Method, Book 1AlgebraISBN:9780395977224Author:Richard G. Brown, Mary P. Dolciani, Robert H. Sorgenfrey, William L. ColePublisher:McDougal Littell
 Linear Algebra: A Modern IntroductionAlgebraISBN:9781285463247Author:David PoolePublisher:Cengage Learning
Glencoe Algebra 1, Student Edition, 9780079039897...
Algebra
ISBN:9780079039897
Author:Carter
Publisher:McGraw Hill
Holt Mcdougal Larson Pre-algebra: Student Edition...
Algebra
ISBN:9780547587776
Author:HOLT MCDOUGAL
Publisher:HOLT MCDOUGAL
College Algebra (MindTap Course List)
Algebra
ISBN:9781305652231
Author:R. David Gustafson, Jeff Hughes
Publisher:Cengage Learning
Algebra: Structure And Method, Book 1
Algebra
ISBN:9780395977224
Author:Richard G. Brown, Mary P. Dolciani, Robert H. Sorgenfrey, William L. Cole
Publisher:McDougal Littell
Linear Algebra: A Modern Introduction
Algebra
ISBN:9781285463247
Author:David Poole
Publisher:Cengage Learning
Sampling Methods and Bias with Surveys: Crash Course Statistics #10; Author: CrashCourse;https://www.youtube.com/watch?v=Rf-fIpB4D50;License: Standard YouTube License, CC-BY
Statistics: Sampling Methods; Author: Mathispower4u;https://www.youtube.com/watch?v=s6ApdTvgvOs;License: Standard YouTube License, CC-BY