
Concept explainers
Videos
a.
Find the regression equation.
a.
Answer to Problem 53CE
The regression equation is
Explanation of Solution
Calculation:
The values of x and y are given.
Regression equation:
Software procedure:
Step-by-step procedure to obtain the ‘Regression equation’ using the MegaStat software:
- In an EXCEL sheet enter the data values of x and y.
- Go to Add-Ins > MegaStat >
Correlation /Regression >Regression Analysis . - Select input
range as ‘Sheet1!$B$2:$B$16’ under Y/Dependent variable. - Select input range ‘Sheet1!$A$2:$A$16’ under X/Independent variables.
- Click on OK.
Output obtained using the MegaStat software is as given below:
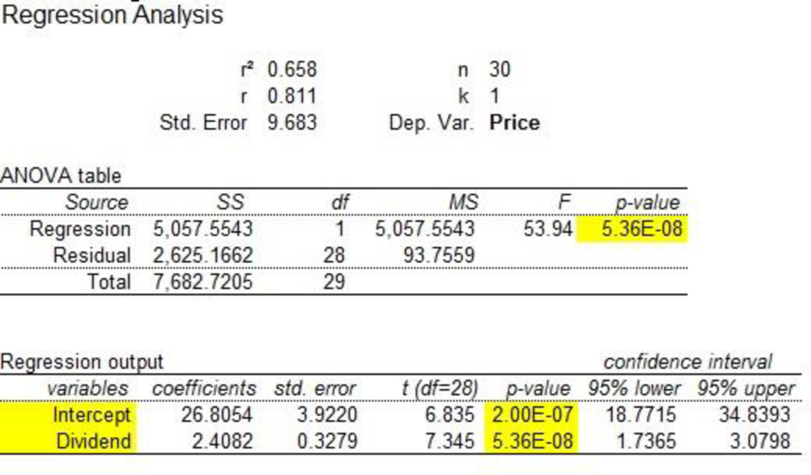
From the output, the regression equation is
Where, y is the price per share and x is the dividend.
b.
Test whether the slope is significant or not.
b.
Answer to Problem 53CE
There is sufficient evidence to conclude that the slope of the regression line is different from zero.
Explanation of Solution
It is given that the regression equation is
The
From the regression equation, the estimated slope of the regression line is
Let
The given test hypotheses are as follows:
Null hypothesis:
That is, the slope of the regression line is equal to zero.
Alternate hypothesis:
That is, the slope of the regression line is not equal to zero.
Assume that the level of significance is 0.05.
Test statistic:
The t-test statistic is as follows:
Where,
Thus, the following is obtained:
Here, the sample size is
Critical value:
Software procedure:
Step-by-step software procedure to obtain the critical value
- Open an EXCEL file.
- In cell A1, enter the formula “=T.INV(0.025,28)”.
Output obtained using the EXCEL is given as follows:
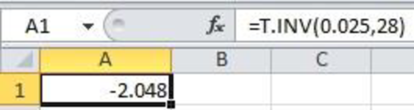
From the EXCEL output, the critical value is –2.048 (
Decision based on the critical value:
Reject the null hypothesis, if
Conclusion:
The t-calculated value is –7.34 and the critical value is –2.048.
That is,
Thus, the null hypothesis is rejected.
Hence, there is sufficient evidence to conclude that the slope of the regression line is different from zero.
c.
Find and interpret the value of coefficient of determination.
c.
Answer to Problem 53CE
The coefficient of determination is 0.658.
Explanation of Solution
From Part (a), the value of coefficient of determination is 0.658.
Therefore, 65.8% of variation in the ‘selling price’ is explained by ‘the annual dividend’.
d.
Find the value of
Test whether the correlation in the population is greater than zero or not.
d.
Answer to Problem 53CE
The correlation coefficient is 0.811.
There is enough evidence to infer that the correlation in the population is greater than zero.
Explanation of Solution
Calculation:
The correlation coefficient is as follows:
The given sample size is 30 and correlation is 0.811.
Denote the population correlation as
The hypotheses are given below:
Null hypothesis:
That is, the correlation in the population is less than or equal to zero.
Alternative hypothesis:
That is, the correlation in the population is greater than zero.
Test statistic:
The test statistic is as follows:
Here, the sample size is 30 and the correlation coefficient is 0.811.
The test statistic is as follows:
Degrees of freedom:
The level of significance is 0.05. Therefore,
Critical value:
Software procedure:
Step-by-step software procedure to obtain the critical value using the EXCEL software:
- Open an EXCEL file.
- In cell A1, enter the formula “=T.INV (0.95, 28)”.
Output obtained using the EXCEL is given as follows:
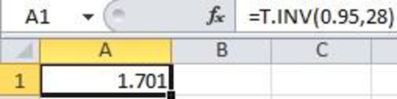
From the EXCEL output, the critical value is 1.701.
Conclusion:
The value of test statistic is 7.34 and the critical value is 1.701.
Here,
By the rejection rule, reject the null hypothesis.
Thus, there is enough evidence to infer that the correlation in the population is greater than zero.
Want to see more full solutions like this?
Chapter 13 Solutions
EBK STATISTICAL TECHNIQUES IN BUSINESS


- Three players (one divider and two choosers) are going to divide a cake fairly using the lone divider method. The divider cuts the cake into three slices (s1, s2, and s3). If the choosers' declarations are Chooser 1: {s1 , s2} and Chooser 2: {s2 , s3}. Using the lone-divider method, how many different fair divisions of this cake are possible?arrow_forwardTheorem 2.6 (The Minkowski inequality) Let p≥1. Suppose that X and Y are random variables, such that E|X|P <∞ and E|Y P <00. Then X+YpX+Yparrow_forwardTheorem 1.2 (1) Suppose that P(|X|≤b) = 1 for some b > 0, that EX = 0, and set Var X = 0². Then, for 0 0, P(X > x) ≤e-x+1²² P(|X|>x) ≤2e-1x+1²² (ii) Let X1, X2...., Xn be independent random variables with mean 0, suppose that P(X ≤b) = 1 for all k, and set oσ = Var X. Then, for x > 0. and 0x) ≤2 exp Σ k=1 (iii) If, in addition, X1, X2, X, are identically distributed, then P(S|x) ≤2 expl-tx+nt²o).arrow_forward
- Theorem 5.1 (Jensen's inequality) state without proof the Jensen's Ineg. Let X be a random variable, g a convex function, and suppose that X and g(X) are integrable. Then g(EX) < Eg(X).arrow_forwardCan social media mistakes hurt your chances of finding a job? According to a survey of 1,000 hiring managers across many different industries, 76% claim that they use social media sites to research prospective candidates for any job. Calculate the probabilities of the following events. (Round your answers to three decimal places.) answer parts a-c. a) Out of 30 job listings, at least 19 will conduct social media screening. b) Out of 30 job listings, fewer than 17 will conduct social media screening. c) Out of 30 job listings, exactly between 19 and 22 (including 19 and 22) will conduct social media screening. show all steps for probabilities please. answer parts a-c.arrow_forwardQuestion: we know that for rt. (x+ys s ا. 13. rs. and my so using this, show that it vye and EIXI, EIYO This : E (IX + Y) ≤2" (EIX (" + Ely!")arrow_forward
- Theorem 2.4 (The Hölder inequality) Let p+q=1. If E|X|P < ∞ and E|Y| < ∞, then . |EXY ≤ E|XY|||X|| ||||qarrow_forwardTheorem 7.6 (Etemadi's inequality) Let X1, X2, X, be independent random variables. Then, for all x > 0, P(max |S|>3x) ≤3 max P(S| > x). Isk≤narrow_forwardTheorem 7.2 Suppose that E X = 0 for all k, that Var X = 0} x) ≤ 2P(S>x 1≤k≤n S√2), -S√2). P(max Sk>x) ≤ 2P(|S|>x- 1arrow_forwardThree players (one divider and two choosers) are going to divide a cake fairly using the lone divider method. The divider cuts the cake into three slices (s1, s2, and s3).If the chooser's declarations are Chooser 1: {s3} and Chooser 2: {s3}, which of the following is a fair division of the cake?arrow_forwardTheorem 1.4 (Chebyshev's inequality) (i) Suppose that Var X x)≤- x > 0. 2 (ii) If X1, X2,..., X, are independent with mean 0 and finite variances, then Στη Var Xe P(|Sn| > x)≤ x > 0. (iii) If, in addition, X1, X2, Xn are identically distributed, then nVar Xi P(|Sn> x) ≤ x > 0. x²arrow_forwardTheorem 2.5 (The Lyapounov inequality) For 0arrow_forwardarrow_back_iosSEE MORE QUESTIONSarrow_forward_iosRecommended textbooks for you
 Glencoe Algebra 1, Student Edition, 9780079039897...AlgebraISBN:9780079039897Author:CarterPublisher:McGraw Hill
 Big Ideas Math A Bridge To Success Algebra 1: Stu...AlgebraISBN:9781680331141Author:HOUGHTON MIFFLIN HARCOURTPublisher:Houghton Mifflin Harcourt
 Functions and Change: A Modeling Approach to Coll...AlgebraISBN:9781337111348Author:Bruce Crauder, Benny Evans, Alan NoellPublisher:Cengage Learning
 Holt Mcdougal Larson Pre-algebra: Student Edition...AlgebraISBN:9780547587776Author:HOLT MCDOUGALPublisher:HOLT MCDOUGAL
Glencoe Algebra 1, Student Edition, 9780079039897...AlgebraISBN:9780079039897Author:CarterPublisher:McGraw HillBig Ideas Math A Bridge To Success Algebra 1: Stu...AlgebraISBN:9781680331141Author:HOUGHTON MIFFLIN HARCOURTPublisher:Houghton Mifflin HarcourtFunctions and Change: A Modeling Approach to Coll...AlgebraISBN:9781337111348Author:Bruce Crauder, Benny Evans, Alan NoellPublisher:Cengage LearningHolt Mcdougal Larson Pre-algebra: Student Edition...AlgebraISBN:9780547587776Author:HOLT MCDOUGALPublisher:HOLT MCDOUGAL