
Videos
Reminder Round all answers to two decimal places unless otherwise indicated.
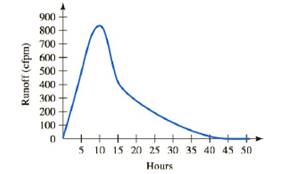
Hydrographs When a rainfall brings more water than the soil can absorb, runoff occurs, and hydrologists refer to the event as a rainfall excess. The easiest way to envision runoff is to think of a watershed that drains into the mouth of a single stream. The runoff is the number of cubic feet per minute (cfpm) being dumped into the mouth of the stream. An important way of depicting runoff is the hydrograph, which is simply the graph of total discharge, in cubic feet per minute, versus time. A typical runoff hydrograph is shown in Figure
a. Time to peak is the elapsed time from the start of rainfall excess to peak runoff. What is the time to peak shown by the hydrograph in Figure
b. Time of concentration is the elapsed time from the end of rainfall excess to the inflection point after peak runoff. The end of rainfall excess is not readily apparent from a hydrograph, but it occurs before the peak. If the end of rainfall excess occurred 5 hours after the start of rainfall excess. estimate the time of concentration from Figure
c. Recession time is the time from peak runoff to the end of runoff. Estimate the recession time for the hydrograph in Figure
d. Time base is the time from beginning to end of surface runoff. What is the time base for the hydrograph in Figure
FIGURE
Want to see the full answer?
Check out a sample textbook solution
Chapter 1 Solutions
Functions and Change: A Modeling Approach to College Algebra (MindTap Course List)


- 1. Let 15 -14 A = -10 9 13-12 -8 7 11 15 -14 13 -12 -6 and B = -10 9 -8 7 -6 5 -4 3 -2 E 5 -4 3 -2 1 Explicitly give the values of A2,3, A1,5, and B1,4- Is A a 5 x 3 matrix? Explain your answer. Are A and B (mathematically) equal? Explain your answer.arrow_forwardGiven the following set X = {2, 4, 6, 8} and Y = {1, 2, 3}, explicitly give (e.g., write down the sets with numerical entries) of the outputs of the following requested set operations: (a) [2 points] XUY (Union) (b) [2 points] XY (Intersection) (c) [3 points] X\Y (Difference) (d) [3 points] XAY (Symmetric Difference)arrow_forwardFor what values of k will the equation (k + 1)x² + 6kx + 2k² - x = 0 have: a) one root equal zero b) one root the reciprocal of the other c) roots numerically equal but of opposite signarrow_forward
- 1) Find The inverse The domain of m(x) = tion and of the function The inverse function 3- √x-aarrow_forwardGraph the following function. Please also graph the asymptote. Thank you.arrow_forwardFile Edit View History Bookmarks Profiles Tab Window Window Help Things Quadratics! Part 1 X SM◄))) 61% Fri 25 student.desmos.com/activitybuilder/instance/67b739e7356cae7898fd0dbd/student/67b8f115811d42186c239e23#screenid=41a95 ngs Quadratics! Part 1: Parabolas Mitchell 30 30 foo feet 20- 20 10 0 -10 FEB 21 3 10 10 80 FS F3 X Intercepts #2 20 20 Approximately how tall is the shooter? > Which intercept did you use to solve the above problem? x-intercept y-intercept 30 feet Explain your thinking. 1 √E Submit 00000 acBook stv 399 ? DOD 000 F4 % 5 W E R F5 A F6 F7 F9 & * 7 8 9 0 Y U C 014arrow_forward
- The table below shows the acreage, number of visitors, and total revenue of state parks and recreational areas in Massachusetts, New York, and Vermont in 2010. State Acreage (in thousands) Visitors (in thousands) Revenue (in thousands) Massachusetts 350 35,271 $12,644 New York 1,354 56,322 $85,558 Vermont 69 758 $10,969 Select the three true statements based on the data in the table. A. Vermont had the highest revenue per acre of state parks and recreational areas. B. Vermont had approximately 11 visitors per acre of state parks and recreational areas. C. New York had the highest number of visitors per acre of state parks and recreational areas. D. Massachusetts had approximately 36 visitors per acre of state parks and recreational areas. E. New York had revenue of approximately $63.19 per acre of state parks and recreational areas. F. Massachusetts had revenue of approximately $0.03 per acre of state parks and recreational areas.arrow_forwarda) show that the empty set and sigletonset are convex set. 6) show that every sub space of linear space X is convex but the convers heed not be true. c) let Mand N be two convex set of a linear Space X and KEF Show that MUN is conevex and (ii) M-N is convex or hot A and is MSN or NSM show that MUN convex or not, 385arrow_forwardI write with prove one-to-one linear Sanction but not onto Lexample.) b) write with Prove on to linear function but not oh-to-on (example). c) write with prove example x=y St Xandy two linear space over Sielad F.arrow_forward
- Find the sample space. Sunscreen SPF 10, 15, 30, 45, 50 Type Lotion, Spray, Gelarrow_forwardFor each graph below, state whether it represents a function. Graph 1 24y Graph 2 Graph 3 4 2 -8 -6 -4 -2 -2 2 4 6 Function? ○ Yes ○ No ○ Yes ○ No Graph 4 Graph 5 8 Function? Yes No Yes No -2. ○ Yes ○ No Graph 6 4 + 2 4 -8 -6 -4 -2 2 4 6 8 Yes -4++ Noarrow_forwardPractice k Help ises A 96 Anewer The probability that you get a sum of at least 10 is Determine the number of ways that the specified event can occur when two number cubes are rolled. 1. Getting a sum of 9 or 10 3. Getting a sum less than 5 2. Getting a sum of 6 or 7 4. Getting a sum that is odd Tell whether you would use the addition principle or the multiplication principle to determine the total number of possible outcomes for the situation described. 5. Rolling three number cubes 6. Getting a sum of 10 or 12 after rolling three number cubes A set of playing cards contains four groups of cards designated by color (black, red, yellow, and green) with cards numbered from 1 to 14 in each group. Determine the number of ways that the specified event can occur when a card is drawn from the set. 7. Drawing a 13 or 14 9. Drawing a number less than 4 8. Drawing a yellow or green card 10. Drawing a black, red, or green car The spinner is divided into equal parts. Find the specified…arrow_forward
 Algebra & Trigonometry with Analytic GeometryAlgebraISBN:9781133382119Author:SwokowskiPublisher:Cengage
 College Algebra (MindTap Course List)AlgebraISBN:9781305652231Author:R. David Gustafson, Jeff HughesPublisher:Cengage Learning
 Trigonometry (MindTap Course List)TrigonometryISBN:9781305652224Author:Charles P. McKeague, Mark D. TurnerPublisher:Cengage Learning
 College AlgebraAlgebraISBN:9781305115545Author:James Stewart, Lothar Redlin, Saleem WatsonPublisher:Cengage Learning
 Glencoe Algebra 1, Student Edition, 9780079039897...AlgebraISBN:9780079039897Author:CarterPublisher:McGraw Hill
 Big Ideas Math A Bridge To Success Algebra 1: Stu...AlgebraISBN:9781680331141Author:HOUGHTON MIFFLIN HARCOURTPublisher:Houghton Mifflin Harcourt