
Concept explainers
Videos
a.
Identify the dependent variable and independent variable.
a.
Answer to Problem 1SR
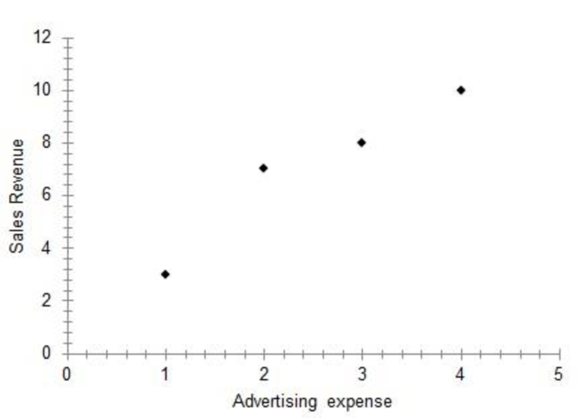
The dependent variable is the ‘sales revenue’ and the independent variable is the ‘advertising expense’.
Explanation of Solution
Data on the number of times the advertisement was aired and digital camera sales are given.
Independent variable:
The variable that can be used to predict the values of other variable is called an independent variable.
Dependent variable:
The variable that can be predicted by other variables is called a response variable or a dependent variable.
Here, the variable ‘sales revenue’ can be predicted using the variable ‘advertising expense’. Therefore, the dependent variable is the ‘sales revenue’ and the independent variable is the ‘advertising expense’.
b.
Construct a
b.
Answer to Problem 1SR
The scatter diagram of the data is represented below:
Explanation of Solution
Calculation:
The scatterplot of the data is as follows:
Software Procedure:
Step-by-step procedure to obtain the scatterplot using Mega Stat software:
- In an EXCEL sheet enter the data values of x and y.
- Go to Add-Ins > Mega Stat >
Correlation/Regression > Scatterplot. - Enter horizontal axis as $A$1:$A$5 and vertical axis as $B$1:$B$5.
- Click on OK.
The scatterplot of the data shows an increasing trend.
c.
Find the
c.
Answer to Problem 1SR
Thus, the
Explanation of Solution
Calculation:
Software procedure:
Step-by-step procedure to obtain the correlation matrix using Mega Stat software:
- In an EXCEL sheet enter the data values of x and y.
- Go to Add-Ins > Mega Stat > Correlation/Regression > Correlation matrix.
- Enter Input
Range as $A$1:$b$5. - Click on OK.
Output obtained using Mega Stat is given as follows:
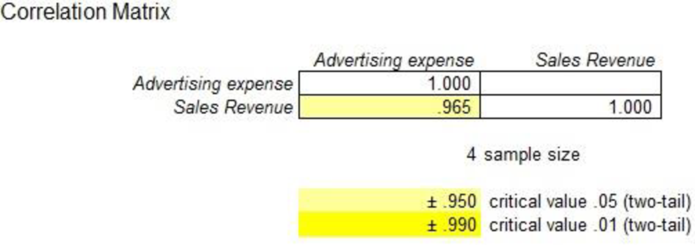
Thus, the correlation coefficient is 0.965.
d.
Interpret the strength of the correlation coefficient.
d.
Explanation of Solution
From Part (c), the correlation coefficient is 0.965. Since the correlation coefficient is positive and close to 1, there is a strong
Want to see more full solutions like this?
Chapter 13 Solutions
Loose Leaf for Statistical Techniques in Business and Economics


- A company found that the daily sales revenue of its flagship product follows a normal distribution with a mean of $4500 and a standard deviation of $450. The company defines a "high-sales day" that is, any day with sales exceeding $4800. please provide a step by step on how to get the answers in excel Q: What percentage of days can the company expect to have "high-sales days" or sales greater than $4800? Q: What is the sales revenue threshold for the bottom 10% of days? (please note that 10% refers to the probability/area under bell curve towards the lower tail of bell curve) Provide answers in the yellow cellsarrow_forwardFind the critical value for a left-tailed test using the F distribution with a 0.025, degrees of freedom in the numerator=12, and degrees of freedom in the denominator = 50. A portion of the table of critical values of the F-distribution is provided. Click the icon to view the partial table of critical values of the F-distribution. What is the critical value? (Round to two decimal places as needed.)arrow_forwardA retail store manager claims that the average daily sales of the store are $1,500. You aim to test whether the actual average daily sales differ significantly from this claimed value. You can provide your answer by inserting a text box and the answer must include: Null hypothesis, Alternative hypothesis, Show answer (output table/summary table), and Conclusion based on the P value. Showing the calculation is a must. If calculation is missing,so please provide a step by step on the answers Numerical answers in the yellow cellsarrow_forward
