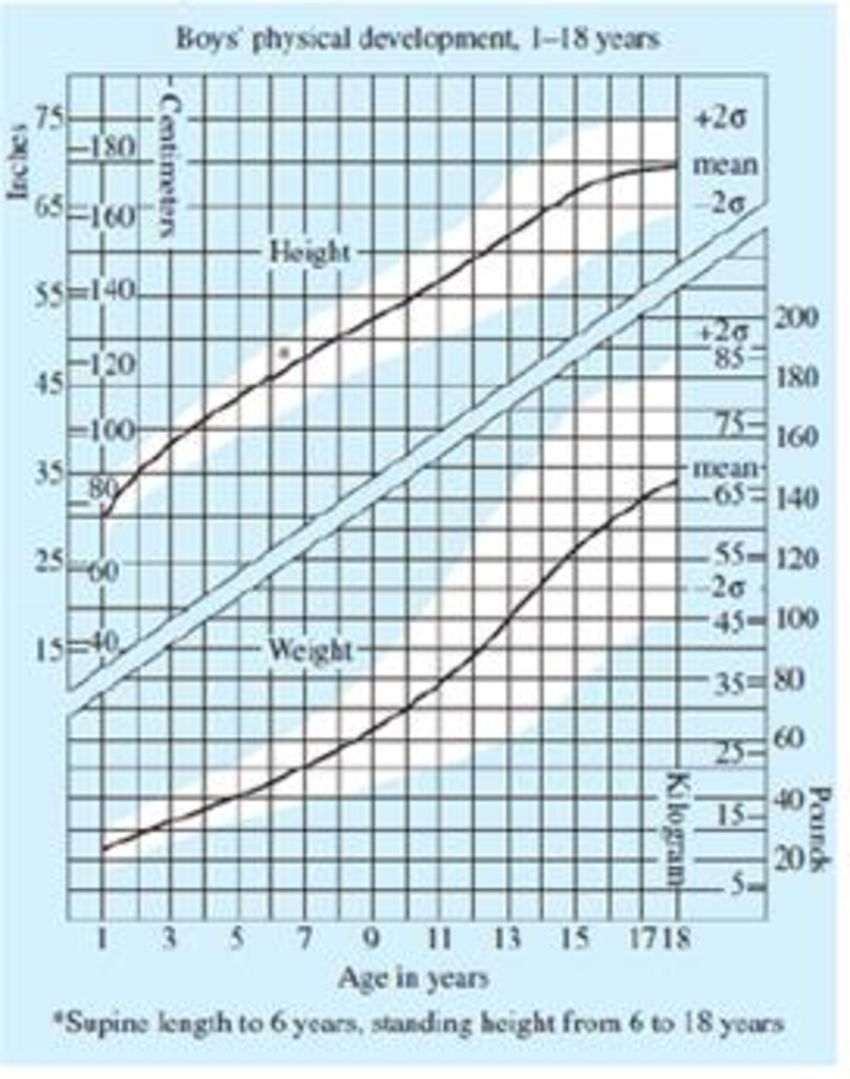
Height and Weight Distribution The chart shown below uses the symbol σ to represent the standard deviation. Note that 2σ represents the value that is two standard deviations above the mean −2σ represents the value that is two standard deviations below the mean. The unshaded areas, from two standard deviations below the mean to two standard deviations above the mean, are considered the normal range. For example, the average (mean) 8-year-old boy has a height of about 50 inches, but any heights between approximately 45 inches and 55 inches are considered normal for 8-year-old boys. Refer to the chart at the bottom of the previous column to answer the following questions.

- a. What happens to the standard deviation for weights of boys as the age of boys increases? What is the significance of this fact?
- b. Determine the mean weight and normal range for boys at age 13.
- c. Determine the mean height and normal range for boys at age 13.
- d. At age 17, what is the mean weight, in pounds, of boys?
- e. Vi/hat is the approximate standard deviation of boys' weights at age 17?
- f. Assuming that this chart was constructed so that approximately 95% of all boys are always in the normal range, determine what percentage of boys are not in the normal range.
Trending nowThis is a popular solution!

Chapter 12 Solutions
A Survey of Mathematics with Applications (10th Edition) - Standalone book
- 5. Find the greatest common divisor (GCD) of 24 and 36. 6. Is 121 a prime number? If not, find its factors.arrow_forward13. If a fair coin is flipped, what is the probability of getting heads? 14. A bag contains 3 red balls and 2 blue balls. If one ball is picked at random, what is the probability of picking a red ball?arrow_forward24. What is the value of ¿4, where i 25. Simplify log2 (8). = −1? 26. If P(x) = x³- 2x² + 5x - 10, find P(2). 27. Solve for x: e2x = 7.arrow_forward
- Listen ANALYZING RELATIONSHIPS Describe the x-values for which (a) f is increasing or decreasing, (b) f(x) > 0 and (c) f(x) <0. y Af -2 1 2 4x a. The function is increasing when and decreasing whenarrow_forwardBy forming the augmented matrix corresponding to this system of equations and usingGaussian elimination, find the values of t and u that imply the system:(i) is inconsistent.(ii) has infinitely many solutions.(iii) has a unique solutiona=2 b=1arrow_forward3/4+1/2=arrow_forwardif a=2 and b=1 1) Calculate 49(B-1)2+7B−1AT+7ATB−1+(AT)2 2)Find a matrix C such that (B − 2C)-1=A 3) Find a non-diagonal matrix E ̸= B such that det(AB) = det(AE)arrow_forward1.2.17. (!) Let G,, be the graph whose vertices are the permutations of (1,..., n}, with two permutations a₁, ..., a,, and b₁, ..., b, adjacent if they differ by interchanging a pair of adjacent entries (G3 shown below). Prove that G,, is connected. 132 123 213 312 321 231arrow_forwardProve that Pleas -- Pleas A collection, Alof countinoes Sunction on a toplogical spacex separetes Point from closed setsinx (f the set S" (V) for KEA and V open set in xx from base for Top onx. @If faixe A} is collection of countinuous fancton on a top space X Wich Separates Points from closed sets then the toplogy on x is weak Top logy.arrow_forwardarrow_back_iosSEE MORE QUESTIONSarrow_forward_ios
 Big Ideas Math A Bridge To Success Algebra 1: Stu...AlgebraISBN:9781680331141Author:HOUGHTON MIFFLIN HARCOURTPublisher:Houghton Mifflin Harcourt
 Glencoe Algebra 1, Student Edition, 9780079039897...AlgebraISBN:9780079039897Author:CarterPublisher:McGraw Hill
 Holt Mcdougal Larson Pre-algebra: Student Edition...AlgebraISBN:9780547587776Author:HOLT MCDOUGALPublisher:HOLT MCDOUGAL
 College Algebra (MindTap Course List)AlgebraISBN:9781305652231Author:R. David Gustafson, Jeff HughesPublisher:Cengage Learning


