Videos
Chebyshev’s Theorem How can you determine whether a distribution is approximately normal? A statistical theorem called Chebyshev’s theorem states that the minimum percent of data between plus and minus K standard deviations from the mean (K > 1) in any distribution can be found by the formula
Minimum percent =
Thus, for example, between ±2 standard deviations from the mean there will always be a minimum of 75% of data. This minimum percent applies to any distribution For K = 2,
Minimum percent
Likewise, between ±3 standard deviations from the mean there will always be a minimum of 89% of the data. For K = 3,
Minimum percent
The following table lists the minimum percent of data in any distribution and the actual percent of data in the normal distribution between ±1.1, ± 1.5, ± 2.0, and ±2.5 standard deviations from the mean. The minimum percents of data m any distribution were calculated by using Chebyshev’s theorem. The actual percents of data for the normal distribution were calculated by using the area given in the standard normal, or z, table.
| K = 1.1 | K = 1.5 | K = 2 | K = 2.5 | |
| Minimum (for any distribution) | 17.4% | 55.6% | 75% | 84% |
| Normal distribution | 72.9% | 86.6% | 95.4% | 98.8% |
| Given distribution |
The third row of the chart has been left blank for you to fill in the percents when you reach part (e).
Consider the following 30 pieces of data obtained from a quiz.
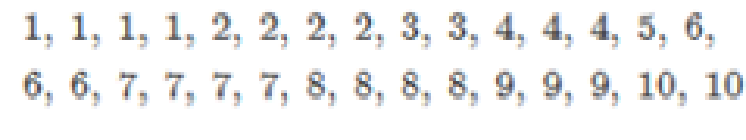
- a. Determine the mean of the set of scores.
- b. Determine the standard deviation of the set of scores.
- c. Determine the values that correspond to 1.1, 1.5, 2, and 2.5 standard deviations above the mean. Then determine the values that correspond to 1.1, 1.5, 2, and 2. 5 standard deviations below the mean.
- d. By observing the 30 pieces of data, determine the actual percent of quiz scores between
±1.1 standard deviations from the mean.
±1.5 standard deviations from the mean.
±2 tandard deviations from the mean.
±2.5 standard deviations from the mean.
- e. Place the percents found in part (d) in the third row of the chart.
- f. Compare the percents in the third row of the chart with the minimum percents in the first row and the normal percents in the second row, and then make a judgment as to whether this set of 30 scores is approximately
normally distributed .
Want to see the full answer?
Check out a sample textbook solution
Chapter 12 Solutions
A Survey of Mathematics with Applications (10th Edition) - Standalone book


- Which diagram(s) represent the following relationships An injective function from A to B? A surjective function from A to B? An injective function from B to A? A surjective function from B to A?arrow_forwardint/PlayerHomework.aspx?homeworkId=689099898&questionId=1&flushed=false&cid=8120746¢erw BP Physical Geograph... HW Score: 0%, 0 of 13 points ○ Points: 0 of 1 Determine if the values of the variables listed are solutions of the system of equations. 2x - y = 4 3x+5y= - 6 x=1, y = 2; (1,-2) Is (1, 2) a solution of the system of equations? L No Yes iew an example Get more help - Aarrow_forwardDetermine if each statement is true or false. If the statement is false, provide a brief explanation: a) There exists x = R such that √x2 = -x. b) Let A = {x = ZIx = 1 (mod 3)} and B = {x = ZIx is odd}. Then A and B are disjoint. c) Let A and B be subsets of a universal set U. If x = A and x/ € A - B,then x = An B.| E d) Let f : RR be defined by f (x) = 1 x + 2 1. Then f is surjective.arrow_forward
- Write the negation of the definition of an injective functionarrow_forwardLet U= {0, 1, 2, 3, 4, 5, 6, 7, 8, 9}, A = {xeU Ix is a multiple of 3}, and B = {x = UIx = 0 (mod 2)}. Use the roster method to list all elements in each of the following sets: a) A, b) B, c) A u B, d) B – A, e) A^cn Barrow_forwardThe function f is; Injective (only), Surjective (only), Bijective, or none? show workarrow_forward
- For each a Є Z, if a ‡0 (mod 3), then a² = 1 (mod 3).arrow_forwardfind: f(3)=? , and the set of all preimages of 2 is ?arrow_forward12:01 PM Tue May 13 < AA ✓ Educatic S s3.amazona... A Assess Your... 目 accelerate-iu15-bssd.vschool.com S s3.amazona... Trigonometric Identities Module Exam Dashboard ... Dashboard ... Algebra 2 Pa... Algebra 2 Part 4 [Honors] (Acc. Ed.) (Zimmerman) 24-25 / Module 11: Trigonometric Identities i + 38% ✰ Start Page Alexis Forsythe All changes saved 10. A sound wave's amplitude can be modeled by the function y = −7 sin ((x-1) + 4). Within the interval 0 < x < 12, when does the function have an amplitude of 4? (Select all that apply.) 9.522 seconds 4.199 seconds 0.522 seconds 1.199 seconds Previous 10 of 20 Nextarrow_forward
 Glencoe Algebra 1, Student Edition, 9780079039897...AlgebraISBN:9780079039897Author:CarterPublisher:McGraw Hill
 Big Ideas Math A Bridge To Success Algebra 1: Stu...AlgebraISBN:9781680331141Author:HOUGHTON MIFFLIN HARCOURTPublisher:Houghton Mifflin Harcourt