Concept explainers
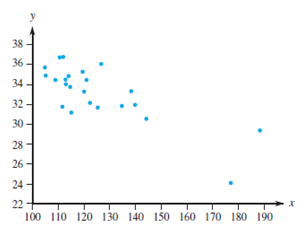
One factor in the development of tennis elbow, a malady that strikes fear in the hearts of all serious tennis players, is the impact-induced vibration of the racket-and-arm system at ball contact. It is well known that the likelihood of getting tennis elbow depends on various properties of the racket used. Consider the
Trending nowThis is a popular solution!
Chapter 12 Solutions
Probability and Statistics for Engineering and the Sciences
- Repeat Example 5 when microphone A receives the sound 4 seconds before microphone B.arrow_forwardWhat does the y -intercept on the graph of a logistic equation correspond to for a population modeled by that equation?arrow_forwardOphthalmologyRetinitis pigmentosa (RP) is a hereditary ocular diseasein which patches of pigment appear on the retina, potentially resulting in substantial vision loss and in somecases complete blindness. An important issue is how fastthe subjects decline. Visual field is an important measureof area of vision, which is measured in degree2. A visualfield area for a normal person is around 11,000 degree2.The longitudinal data in Table 11.29 were provided by anindividual patient.Table 11.29 Longitudinal visual field data forone RP patientTime Visual field area lnVisit (yr) (degree2) (visual field area)1 0 3059 8.032 1 3053 8.023 2 1418 7.264 3 1692 7.435 4 1978 7.596 5 1567 7.367 6 1919 7.568 7 1998 7.609 11 1648 7.4110 13 1721 7.4511 15 1264 7.14mean 6.09 1938 7.532sd 4.97 597 0.280Suppose the rate of change of ln (visual field) is a linearfunction of follow-up time.11.103 Write down a linear regression model that summarizes this relationship.11.104 Fit the regression line using…arrow_forward
- A paper gives data on x = change in Body Mass Index (BMI, in kilograms/meter) and y = change in a measure of depression for patients suffering from depression who participated in a pulmonary rehabilitation program. The table below contains a subset of the data given in the paper and are approximate values read from a scatterplot in the paper. BMI Change (kg/m²) -0.5 0.7 0.5 0.1 0.8 1 1.5 1.2 1 0.4 0.4 Depression Score Change -1 4 4 8 13 14 16 18 12 14 The accompanying computer output is from Minitab. Fitted Line Plot Depression score change = 6.598 + 5.327 BMI change 20- 5.10254 R-Sq R-Sq (adj) 20.06% 27.32% 15- 10- 5- 0- -0.5 0.0 0.5 1.0 1.5 BMI change R-sq 5.10254 27.32% Coefficients Term Coef SE Coef T-Value P-Value VIF Constant 6.598 2.19 3.01 0.0132 BMI change 5.327 2.75 1.94 0.0812 1.00 Regression Equation Depression score change = 6.598 + 5.327 BMI change (a) What percentage of observed variation in depression score change can be explained by the simple linear regression model?…arrow_forwardA paper gives data on x = change in Body Mass Index (BMI, in kilograms/meter2) and y = change in a measure of depression for patients suffering from depression who participated in a pulmonary rehabilitation program. The table below contains a subset of the data given in the paper and are approximate values read from a scatterplot in the paper. BMI Change (kg/m²) 0.5 -0.5 0 0.1 0.7 0.8 1 1.5 1.2 1 0.4 0.4 Depression Score Change -1 9 4 4 5 8 13 14 17 18 12 14 The accompanying computer output is from Minitab. Fitted Line Plot Depression score change = 6.512 + 5.472 BMI change 20 S 5.26270 R-Sq 27.16% R-Sq (adj) 19.88% 15- : 10- -0.5 0.0 1.5 Ⓡ S 5.26270 Coefficients Term Coef VIF SE Coef 2.26 T-Value 2.88 P-Value 0.0164 Constant 6.512 BMI change 5.472 2.83 1.93 0.0823 1.00 Regression Equation Depression score change = 6.512 + 5.472 BMI change (a) What percentage of observed variation in depression score change can be explained by the simple linear regression model? (Round your answer to…arrow_forwardHoaglin, Mosteller, and Tukey (1983) presented data on blood levels of beta-endorphin as a function of stress. They took beta-endorphin levels for 19 patients 12 hours before surgery and again 10 minutes before surgery. The data are presented below, in fmol/ml Based on these date, what effect does icreased stressed have on endorphin levels. Solve by hand or SPSS. Participant 12 hours before 10 minutes before 1 10 6.5 2 6.5 14.0 3 8.0 13.5 4 12 18 5 5.0 14.5 6 11.5 9.0 7 5.0 18.0 8 3.5…arrow_forward
- Assume that you have collected cross-sectional data for average hourly earnings (ahe), the number of years of education (educ) and gender of the individuals (you have coded individuals as "1" if they are female and "0" if they are male; the name of the resulting variable is DFemme). Having faced recent tuition hikes at your university, you are interested in the return to education, that is, how much more will you earn extra for an additional year of being at your institution. To investigate this question, you run the following regression: ahe= -4.58 + 1.71×educ N = 14,925, R2 = 0.18, SER = 9.30 a. Interpret the regression output. b. Being a female, you wonder how these results are affected if you entered a binary variable (DFemme), which takes on the value of "1" if the individual is a female, and is "0" for males. The result is as follows ahe= = -3.44 - 4.09×DFemme + 1.76×educ N = 14,925, R2 = 0.22, SER = 9.08 Does it make sense that the standard error of the regression decreased…arrow_forwardPlease circle your answers. Thank you in advanced!arrow_forwardSuppose a logistic regression model is fitted for the probability of car ownership for residents of a certain city in Oman (Y=1 if a resident owns a car, Y=0 if a resident does not own a car). Suppose the explanatory variables used are x1=no. of years a resident spent in schooling and x2 is gender of the resident of the city (x2=1 for a male and x2=0 for a female resident) a) Interpret el and e82 b) if BO= -1.6, B1=0.4 and B2=3, estimate the probability of a resident in the city owning a car.arrow_forward
- A paper gives data on x = change in Body Mass Index (BMI, in kilograms/meter2) and y = change in a measure of depression for patients suffering from depression who participated in a pulmonary rehabilitation program. The table below contains a subset of the data given in the paper and are approximate values read from a scatterplot in the paper. BMI Change (kg/m²) Depression Score Change S = The accompanying computer output is from Minitab. Depression score change 15- 10- -0.5 S Fitted Line Plot Depression score change = 6.577 +5.440 BMI change 20- 5.30586 Coefficients T 0.0 0.5 -0.5 R-sq 25.96% - 1 Term Coef Constant 6.577 BMI change 5.440 % 0.5 BMI change 1.0 SE Coef 2.28 2.90 9 0 0.1 0.7 0.8 1 1.5 4 T-Value 2.88 1.87 Interpret this estimate. s is the typical amount by which the ---Select--- line. 4 5 Regression Equation Depression score change = 6.577 +5.440 BMI change P-Value 0.0164 0.0906 S 5.30586 25.96% R-Sq R-Sq (adj) 18.56% 8 (b) Give a point estimate of o. (Round your answer to…arrow_forward2) The following table includes the number of mg of a particular drug administered in a treatment, along with the survival outcome of the patient. No Death Death Total Probability Odds Drug Dose 0 1 3 8 2 10 4 6 4 10 5 5 5 10 6 4 6 10 7 2 8 10 a) Complete the columns with the relevant odds and probabilities for the outcome Y=1, ie death. b) What is the logistic regression equation?arrow_forwardA study of the effect of massage on boxing performance measured a boxer's blood lactate concentration (in mM) and perceived recovery (on a 28-point scale). On the basis of the information provided by the study, the data shown in the accompanying table were obtained for 16 five-round boxing performances in which a massage was given to the boxer between rounds. Conduct a test to determine whether blood lactate level (y) is linearly related to perceived recovery (x). Use α = 0.10. Click the icon to view the table of boxer blood data. X Boxer Blood Data Perceived Recovery Determine the correct null and alternative hypotheses. Choose the correct answer below. Blood Lactate Level 3.8 4.4 8 8 O A. Ho: B₁ 0 OB. Ho: B₁0, H₂: B₁ 0 4.1 11 5.0 11 = E. Ho: B₁0, H₂: B₁ #0 OF. Ho: B₁ #0, H₂: B₁ = 0 1 a 1 5.3 11 4.2 14 Find the test statistic. 2.4 17 t = (Round to three decimal places as needed.) 3.7 17 5.3 17 5.8 18 6.0 18 5.9 21 6.3 21 5.5 20 6.5 27arrow_forward
- Linear Algebra: A Modern IntroductionAlgebraISBN:9781285463247Author:David PoolePublisher:Cengage LearningGlencoe Algebra 1, Student Edition, 9780079039897...AlgebraISBN:9780079039897Author:CarterPublisher:McGraw Hill
- Trigonometry (MindTap Course List)TrigonometryISBN:9781337278461Author:Ron LarsonPublisher:Cengage LearningBig Ideas Math A Bridge To Success Algebra 1: Stu...AlgebraISBN:9781680331141Author:HOUGHTON MIFFLIN HARCOURTPublisher:Houghton Mifflin Harcourt