Concept explainers
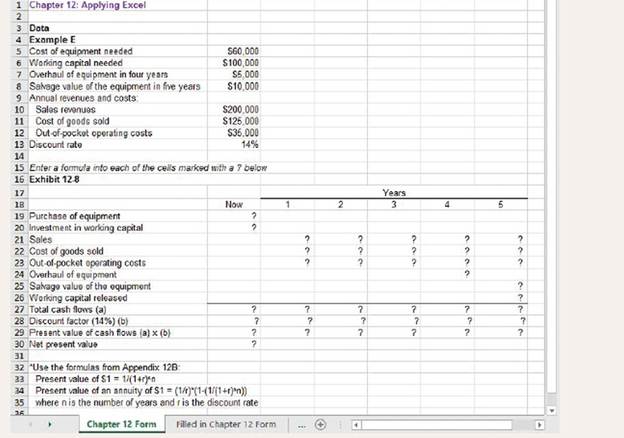
The Excel worksheet form that appears below is to be used to recreate Example E and Exhibit 12-8. Download the workbook containing this form from Connect, where you will also receive instructions about how to use this worksheet form.

 You should proceed to the requirements below only after completing your worksheet. Note that you may get a slightly different
Required:
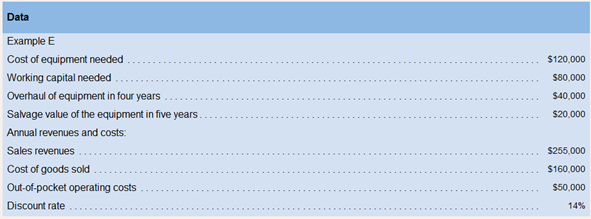
2. The company is considering another project involving the purchase of new equipment. Change the data area of your worksheet to match the following:

a. What is the net present value of the project?
b. Experiment with changing the discount rate in one percent increments (e.g.. 13%. 12%. 15%. etc.). At what interest rate does the net present value turn from negative to positive?
c. The
d. Reset the discount rate to 14%. Suppose the salvage value is uncertain. How large would the salvage value have to be to result in a positive net present value?
1
Net present value NPV is calculated by deducting present value of all the cash inflows from a particular project from the present value of initial cash outflow. NPV helps in identifying the profitability of a project or an investment.
To calculate: The amount of net present value (NPV) for the given project.
Answer to Problem 2AE
NPV is calculated as -$17.340.
Explanation of Solution
Calculation of NPV will be done as follows:
| Particulars | Year 0 ($) | Year 1 ($) | Year 2 ($) | Year 3 ($) | Year 4 ($) | Year 5($) |
| Cost of equipment | -120,000 | |||||
| Working capital needed | -80,000 | |||||
| Sales revenue | 255,000 | 255,000 | 255,000 | 255,000 | 255,000 | |
| Cost of goods sold | -160,000 | -160,000 | -160,000 | -160,000 | -160,000 | |
| Out of pocket operating cost | -50,000 | -50,000 | -50,000 | -50,000 | -50,000 | |
| Working capital released | 80,000 | |||||
| Overhaul cost | -40,000 | |||||
| Salvage value | 20,000 | |||||
| Net cash flow | -200,000 | 45,000 | 45,000 | 45,000 | 5,000 | 145,000 |
| Discount rate (14%) | 1 | 0.877 | 0.769 | 0.675 | 0.592 | 0.519 |
| Present value | -200,000 | 39,465 | 34,605 | 30,375 | 2,960 | 75,255 |
| Net present value (NPV) | -17,340 |
Therefore, NPV is -$17,340.
2
Net present value NPV is calculated by deducting present value of all the cash inflows from a particular project from the present value of initial cash outflow. NPV helps in identifying the profitability of a project or an investment.
The discount rate at which NPV will be positive.
Answer to Problem 2AE
At 10% discount rate NPV will be positive ($5,330).
Explanation of Solution
At 15% discount rate, NPV will be:
| Particulars | Year 0 ($) | Year 1 ($) | Year 2 ($) | Year 3 ($) | Year 4 ($) | Year 5($) |
| Net cash flow | -200,000 | 45,000 | 45,000 | 45,000 | 5,000 | 145,000 |
| Discount rate (15%) | 1 | 0.867 | 0.756 | 0.657 | 0.572 | 0.497 |
| Present value | -200,000 | 39,015 | 34,020 | 29,565 | 2,860 | 72,065 |
| Net present value (NPV) | -22,475 |
At 13% discount rate, NPV will be:
| Particulars | Year 0 ($) | Year 1 ($) | Year 2 ($) | Year 3 ($) | Year 4 ($) | Year 5($) |
| Net cash flow | -200,000 | 45,000 | 45,000 | 45,000 | 5,000 | 145,000 |
| Discount rate (13%) | 1 | 0.885 | 0.783 | 0.693 | 0.613 | 0.543 |
| Present value | -200,000 | 39,825 | 35,235 | 31,185 | 3,065 | 78,735 |
| Net present value (NPV) | -11,955 |
At 12% discount rate, NPV will be:
| Particulars | Year 0 ($) | Year 1 ($) | Year 2 ($) | Year 3 ($) | Year 4 ($) | Year 5($) |
| Net cash flow | -200,000 | 45,000 | 45,000 | 45,000 | 5,000 | 145,000 |
| Discount rate (12%) | 1 | 0.893 | 0.797 | 0.711 | 0.635 | 0.567 |
| Present value | -200,000 | 40,185 | 35,865 | 31,995 | 3,175 | 82,215 |
| Net present value (NPV) | -6,565 |
At 11% discount rate, NPV will be:
| Particulars | Year 0 ($) | Year 1 ($) | Year 2 ($) | Year 3 ($) | Year 4 ($) | Year 5 ($) |
| Net cash flow | -200,000 | 45,000 | 45,000 | 45,000 | 5,000 | 145,000 |
| Discount rate (11%) | 1 | 0.901 | 0.812 | 0.731 | 0.658 | 0.593 |
| Present value | -200,000 | 40,545 | 36,540 | 32,895 | 3,290 | 85,985 |
| Net present value (NPV) | -745 |
At 10% discount rate, NPV will be:
| Particulars | Year 0 ($) | Year 1 ($) | Year 2 ($) | Year 3 ($) | Year 4 ($) | Year 5($) |
| Net cash flow | -200,000 | 45,000 | 45,000 | 45,000 | 5,000 | 145,000 |
| Discount rate (10%) | 1 | 0.909 | 0.826 | 0.751 | 0.683 | 0.621 |
| Present value | -200,000 | 40,905 | 37,170 | 33,795 | 3,415 | 90,045 |
| Net present value (NPV) | 5,330 |
Therefore, NPV will be positive at 10% discount rate.
3
Internal rate of return The interest rate at which NPV of cash flows from an investment is zero is IRR. It helps in identifying if the investment is profitable or not.
IRR is between what two discounting rates.
Answer to Problem 2AE
IRR is 10.884% which is between 10% and 11%.
Explanation of Solution
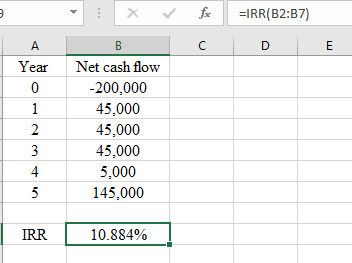
IRR will be calculated as follows:

IRR is 10.884% which means that IRR is between 10% and 11%.
Also, IRR is the interest rate at which NPV is zero. At 10%, NPV is $5,330 (calculated in sub part 1) and at 11%, NPV is -745 (Calculated in sub part 1). This also shows that NPV will be zero at some discount rate between 10% and 11%.
4
Salvage value It represents the amount that a company receives by selling an asset at the end of its useful life. It is considered as a cash inflow.
To calculate: The increase in salvage value that will make the NPV positive at 14% discount rate.
Answer to Problem 2AE
Increase in salvage value is $29,560 and total salvage value is $49,560.
Explanation of Solution
| Particulars | Year 0 ($) | Year 1 ($) | Year 2 ($) | Year 3 ($) | Year 4 ($) | Year 5($) |
| Net cash flow | -200,000 | 45,000 | 45,000 | 45,000 | 5,000 | 145,000 |
| Discount rate (14%) | 1 | 0.877 | 0.769 | 0.675 | 0.592 | 0.519 |
| Present value | -200,000 | 39,465 | 34,605 | 30,375 | 2,960 | 75,255 |
| Net present value (NPV) | -17,340 |
At 14%, total cash outflow is -$200,000, present value of total cash inflows is 182,660 and NPV is negative. NPV will be positive if present value of cash flows will increase by $17,500. Therefore, in year 5 present value of salvage value will increase by $17,500. At year 0, total salvage value will be:
NPV will be positive if total salvage value will be $49,560.
Want to see more full solutions like this?
Chapter 12 Solutions
Introduction To Managerial Accounting
- I don't need ai answer general accounting questionarrow_forwardSolve this questionarrow_forwardUltimate Production manufactures radon detectors. The standard for materials for each detector is 4 pounds of acrylic at a standard cost of $7.30 per pound. During May, the company purchased 975 pounds and used 885 pounds of acrylic, and made 410 radon detectors. The company paid $4.45 per pound for the acrylic. There were 5100 detectors budgeted for May. How much is the material quantity variance?arrow_forward
 Excel Applications for Accounting PrinciplesAccountingISBN:9781111581565Author:Gaylord N. SmithPublisher:Cengage Learning
