
Concept explainers
Videos
Reading Colored Paper (Example 4) Some people believe that it is easier to read words printed on colored paper than words printed on white paper. To test this theory, statistics student Paula Smith collected data. Subjects were timed as they read a pas-sage printed in black ink on a sheet of salmon-colored paper and as they read the same passage printed with black ink on a sheet of white paper. Each person was randomly assigned to read material printed on either the white or the salmon paper first. The times in seconds are given in the table. We are assuming that smaller times (faster reading) imply that the reading is easier. Assume that these are a random sample of times and that the distribution of times is sufficiently close to Normal for
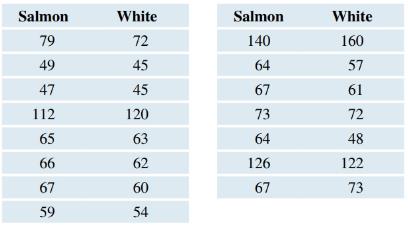
a. Compare the sample
b. Use a two-sample
c. Use a paired
d. Which is the appropriate test for this data set?
e. Why is it essential that the researchers randomly assign the order so that some of the people read material on the salmon-colored paper first and some read material on the white paper first?
Want to see the full answer?
Check out a sample textbook solution
Chapter 12 Solutions
Introductory Statistics
Additional Math Textbook Solutions
Math in Our World
Beginning and Intermediate Algebra
Mathematics for the Trades: A Guided Approach (11th Edition) (What's New in Trade Math)
Elementary Statistics: Picturing the World (7th Edition)
Calculus: Early Transcendentals (2nd Edition)


- A company found that the daily sales revenue of its flagship product follows a normal distribution with a mean of $4500 and a standard deviation of $450. The company defines a "high-sales day" that is, any day with sales exceeding $4800. please provide a step by step on how to get the answers in excel Q: What percentage of days can the company expect to have "high-sales days" or sales greater than $4800? Q: What is the sales revenue threshold for the bottom 10% of days? (please note that 10% refers to the probability/area under bell curve towards the lower tail of bell curve) Provide answers in the yellow cellsarrow_forwardFind the critical value for a left-tailed test using the F distribution with a 0.025, degrees of freedom in the numerator=12, and degrees of freedom in the denominator = 50. A portion of the table of critical values of the F-distribution is provided. Click the icon to view the partial table of critical values of the F-distribution. What is the critical value? (Round to two decimal places as needed.)arrow_forwardA retail store manager claims that the average daily sales of the store are $1,500. You aim to test whether the actual average daily sales differ significantly from this claimed value. You can provide your answer by inserting a text box and the answer must include: Null hypothesis, Alternative hypothesis, Show answer (output table/summary table), and Conclusion based on the P value. Showing the calculation is a must. If calculation is missing,so please provide a step by step on the answers Numerical answers in the yellow cellsarrow_forward
 Glencoe Algebra 1, Student Edition, 9780079039897...AlgebraISBN:9780079039897Author:CarterPublisher:McGraw Hill
 Holt Mcdougal Larson Pre-algebra: Student Edition...AlgebraISBN:9780547587776Author:HOLT MCDOUGALPublisher:HOLT MCDOUGAL
 Algebra & Trigonometry with Analytic GeometryAlgebraISBN:9781133382119Author:SwokowskiPublisher:Cengage
 College Algebra (MindTap Course List)AlgebraISBN:9781305652231Author:R. David Gustafson, Jeff HughesPublisher:Cengage Learning
 Big Ideas Math A Bridge To Success Algebra 1: Stu...AlgebraISBN:9781680331141Author:HOUGHTON MIFFLIN HARCOURTPublisher:Houghton Mifflin Harcourt