
Elementary Statistics: Picturing the World (7th Edition)
7th Edition
ISBN: 9780134683416
Author: Ron Larson, Betsy Farber
Publisher: PEARSON
expand_more
expand_more
format_list_bulleted
Videos
Textbook Question
Chapter 1.2, Problem 23E
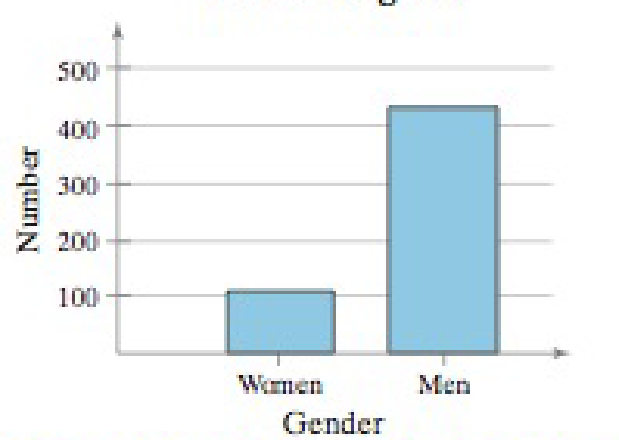
Graphical Analysis In Exercises 21–24, determine the level of measurement of the data listed on the horizontal and vertical axes in the figure.
23. Gender Profile of the 114th Congress
Expert Solution & Answer
Want to see the full answer?
Check out a sample textbook solution
Students have asked these similar questions
Apply STATA commands & submit the output for each question only
when indicated below
İ.
ii.
iii.
iv.
V.
Apply the command summarize on variables bwght and faminc.
What is the average birthweight of babies and family income of
the respondents? Include the output of this code.
Apply the tab command on the variable called male. How many
of the babies and what share of babies are male? Include the
output of this code.
Find the summary statistics (i.e. use the sum command) of the
variables bwght and faminc if the babies are white. Include the
output of this code.
Find the summary statistics (i.e. use the sum command) of the
variables bwght and faminc if the babies are male but not white.
Include the output of this code.
Using your answers to previous subparts of this question: What
is the difference between the average birthweight of a baby who
is male and a baby who is male but not white? What can you say
anything about the difference in family income of the babies that
are male and male…
A public health researcher is studying the impacts of nudge marketing techniques on shoppers vegetables
The director of admissions at Kinzua University in Nova Scotia estimated the distribution of student admissions for the fall semester on the basis of past experience.
Admissions
Probability
1,100
0.5
1,400
0.4
1,300
0.1
Click here for the Excel Data File
Required:
What is the expected number of admissions for the fall semester?
Compute the variance and the standard deviation of the number of admissions.
Note: Round your standard deviation to 2 decimal places.
Chapter 1 Solutions
Elementary Statistics: Picturing the World (7th Edition)
Ch. 1.1 - In a survey of 1501 ninth to twelfth graders in...Ch. 1.1 - Determine whether each number describes a...Ch. 1.1 - A study of 1000 U.S. adults found that when they...Ch. 1.1 - How is a sample related to a population?Ch. 1.1 - Why is a sample used more often than a population?Ch. 1.1 - What is the difference between a parameter and a...Ch. 1.1 - What are the two main branches of statistics?Ch. 1.1 - True or False? In Exercises 510, determine whether...Ch. 1.1 - True or False? In Exercises 510, determine whether...Ch. 1.1 - True or False? In Exercises 510, determine whether...
Ch. 1.1 - True or False? In Exercises 510, determine whether...Ch. 1.1 - True or False? In Exercises 510, determine whether...Ch. 1.1 - True or False? In Exercises 510, determine whether...Ch. 1.1 - Classifying a Data Set In Exercises 1120,...Ch. 1.1 - Classifying a Data Set In Exercises 1120,...Ch. 1.1 - Classifying a Data Set In Exercises 1120,...Ch. 1.1 - Classifying a Data Set In Exercises 1120,...Ch. 1.1 - Classifying a Data Set In Exercises 1120,...Ch. 1.1 - Classifying a Data Set In Exercises 1120,...Ch. 1.1 - Classifying a Data Set In Exercises 1120,...Ch. 1.1 - Classifying a Data Set In Exercises 1120,...Ch. 1.1 - Classifying a Data Set In Exercises 1120,...Ch. 1.1 - Classifying a Data Set In Exercises 1120,...Ch. 1.1 - Graphical Analysis In Exercises 2124, use the Venn...Ch. 1.1 - Graphical Analysis In Exercises 2124, use the Venn...Ch. 1.1 - Graphical Analysis In Exercises 2124, use the Venn...Ch. 1.1 - Graphical Analysis In Exercises 2124, use the Venn...Ch. 1.1 - Identifying Data Sets In Exercises 2534, identify...Ch. 1.1 - Identifying Data Sets In Exercises 2534, identify...Ch. 1.1 - Identifying Data Sets In Exercises 2534, identify...Ch. 1.1 - Identifying Data Sets In Exercises 2534, identify...Ch. 1.1 - Identifying Data Sets In Exercises 2534, identify...Ch. 1.1 - Identifying Data Sets In Exercises 2534, identify...Ch. 1.1 - Identifying Data Sets In Exercises 2534, identify...Ch. 1.1 - Identifying Data Sets In Exercises 2534, identify...Ch. 1.1 - Identifying Data Sets In Exercises 2534, identify...Ch. 1.1 - Identifying Data Sets In Exercises 2534, identify...Ch. 1.1 - Distinguishing Between a Parameter and a Statistic...Ch. 1.1 - Distinguishing Between a Parameter and a Statistic...Ch. 1.1 - Distinguishing Between a Parameter and a Statistic...Ch. 1.1 - Distinguishing Between a Parameter and a Statistic...Ch. 1.1 - Distinguishing Between a Parameter and a Statistic...Ch. 1.1 - Distinguishing Between a Parameter and a Statistic...Ch. 1.1 - Distinguishing Between a Parameter and a Statistic...Ch. 1.1 - Distinguishing Between a Parameter and a Statistic...Ch. 1.1 - Descriptive and Inferential Statistics Which part...Ch. 1.1 - Descriptive and Inferential Statistics Which part...Ch. 1.1 - Exercise and Cognitive Ability A study of 876...Ch. 1.1 - Increase in Obesity Rates A study shows that the...Ch. 1.1 - Sleep and Student Achievement A study shows the...Ch. 1.2 - The populations of several U.S. cities are shown...Ch. 1.2 - For each data set. determine whether the data are...Ch. 1.2 - For each data set, determine whether the data are...Ch. 1.2 - Name each level of measurement for which data can...Ch. 1.2 - Name each level of measurement for which data can...Ch. 1.2 - True or False? In Exercises 36, determine whether...Ch. 1.2 - True or False? In Exercises 36, determine whether...Ch. 1.2 - True or False? In Exercises 36, determine whether...Ch. 1.2 - True or False? In Exercises 36, determine whether...Ch. 1.2 - Classifying Data by Type In Exercises 714,...Ch. 1.2 - Classifying Data by Type In Exercises 714,...Ch. 1.2 - Classifying Data by Type In Exercises 714,...Ch. 1.2 - Classifying Data by Type In Exercises 714,...Ch. 1.2 - Classifying Data by Type In Exercises 714,...Ch. 1.2 - Classifying Data by Type In Exercises 714,...Ch. 1.2 - Classifying Data by Type In Exercises 714,...Ch. 1.2 - Classifying Data by Type In Exercises 714,...Ch. 1.2 - Classifying Data By Level In Exercises 1520,...Ch. 1.2 - Classifying Data By Level In Exercises 1520,...Ch. 1.2 - Classifying Data By Level In Exercises 1520,...Ch. 1.2 - Classifying Data By Level In Exercises 1520,...Ch. 1.2 - Classifying Data By Level In Exercises 1520,...Ch. 1.2 - Classifying Data By Level In Exercises 1520,...Ch. 1.2 - Graphical Analysis In Exercises 2124, determine...Ch. 1.2 - Graphical Analysis In Exercises 2124, determine...Ch. 1.2 - Graphical Analysis In Exercises 2124, determine...Ch. 1.2 - Graphical Analysis In Exercises 2124, determine...Ch. 1.2 - The items below appear on a physician's intake...Ch. 1.2 - Graphical Analysis In Exercises 2124, determine...Ch. 1.2 - Classifying Data by Type and Level In Exercises...Ch. 1.2 - Classifying Data by Type and Level In Exercises...Ch. 1.2 - Classifying Data by Type and Level In Exercises...Ch. 1.2 - Classifying Data by Type and Level In Exercises...Ch. 1.2 - Classifying Data by Type and Level In Exercises...Ch. 1.2 - Classifying Data by Type and Level In Exercises...Ch. 1.2 - Extending Concepts 33. Writing What is an inherent...Ch. 1.2 - Describe two examples of data sets for each of the...Ch. 1.2 - For more than 50 years. The Harris Poll has...Ch. 1.2 - Reputations of 10 Companies in the U.S. (Source:...Ch. 1.2 - Reputations of 10 Companies in the U.S. (Source:...Ch. 1.2 - Reputations of 10 Companies in the U.S. (Source:...Ch. 1.2 - Reputations of 10 Companies in the U.S. (Source:...Ch. 1.2 - For more than 50 years. The Harris Poll has...Ch. 1.3 - The Pennsylvania Game Commission conducted a study...Ch. 1.3 - Prob. 2TYCh. 1.3 - A company employs 79 people. Choose a simple...Ch. 1.3 - You want to determine the opinions of students...Ch. 1.3 - What is the difference between an observational...Ch. 1.3 - What is the difference between a census and a...Ch. 1.3 - What is the difference between a random sample and...Ch. 1.3 - What is replication in an experiment? Why is...Ch. 1.3 - True or False? In Exercises 510, determine whether...Ch. 1.3 - True or False? In Exercises 510, determine whether...Ch. 1.3 - True or False? In Exercises 510, determine whether...Ch. 1.3 - True or False? In Exercises 510, determine whether...Ch. 1.3 - True or False? In Exercises 510, determine whether...Ch. 1.3 - True or False? In Exercises 510, determine whether...Ch. 1.3 - Distinguishing Between an Observational Study and...Ch. 1.3 - Distinguishing Between an Observational Study and...Ch. 1.3 - Distinguishing Between an Observational Study and...Ch. 1.3 - Distinguishing Between an Observational Study and...Ch. 1.3 - Random Number Table Use the sixth row of Table 1...Ch. 1.3 - Random Number Table Use the tenth row of Table 1...Ch. 1.3 - Random Numbers In Exercises 17 and 18, use...Ch. 1.3 - Random Numbers In Exercises 17 and 18, use...Ch. 1.3 - Allergy Drug A pharmaceutical company wants to...Ch. 1.3 - Dietary Supplement Researchers in Germany tested...Ch. 1.3 - Sleep Deprivation A researcher wants to study the...Ch. 1.3 - Using a Simple Random Sample Volunteers for an...Ch. 1.3 - Identifying Sampling Techniques In Exercises 2328,...Ch. 1.3 - Identifying Sampling Techniques In Exercises 2328,...Ch. 1.3 - Identifying Sampling Techniques In Exercises 2328,...Ch. 1.3 - Identifying Sampling Techniques In Exercises 2328,...Ch. 1.3 - Identifying Sampling Techniques In Exercises 2328,...Ch. 1.3 - Identifying Sampling Techniques In Exercises 2328,...Ch. 1.3 - Choosing Between a Census and a Sampling In...Ch. 1.3 - Choosing Between a Census and a Sampling In...Ch. 1.3 - Recognizing a Biased Question In Exercises 3134,...Ch. 1.3 - Recognizing a Biased Question In Exercises 3134,...Ch. 1.3 - Recognizing a Biased Question In Exercises 3134,...Ch. 1.3 - Recognizing a Biased Question In Exercises 3134,...Ch. 1.3 - Open and Closed Questions Two types of survey...Ch. 1.3 - Natural Experiments Observational studies are...Ch. 1.3 - Prob. 1ACh. 1.3 - In Exercises 14, identify the population and the...Ch. 1 - In Exercises 14, identify the population and the...Ch. 1 - In Exercises 14, identify the population and the...Ch. 1 - In Exercises 58, determine whether the number...Ch. 1 - In Exercises 58, determine whether the number...Ch. 1 - In Exercises 58, determine whether the number...Ch. 1 - In Exercises 58, determine whether the number...Ch. 1 - Which part of the survey described in Exercise 3...Ch. 1 - Which part of the survey described in Exercise 4...Ch. 1 - In Exercises 1114, determine whether the data are...Ch. 1 - In Exercises 1114, determine whether the data are...Ch. 1 - In Exercises 1114, determine whether the data are...Ch. 1 - In Exercises 1114, determine whether the data are...Ch. 1 - In Exercises 1518, determine the level of...Ch. 1 - In Exercises 1518, determine the level of...Ch. 1 - In Exercises 1518, determine the level of...Ch. 1 - In Exercises 1518, determine the level of...Ch. 1 - In Exercises 19 and 20, determine whether the...Ch. 1 - In Exercises 19 and 20, determine whether the...Ch. 1 - In Exercises 21 and 22, two hundred students...Ch. 1 - In Exercises 21 and 22, two hundred students...Ch. 1 - Identifying Sampling Techniques In Exercises 2328,...Ch. 1 - Identifying Sampling Techniques In Exercises 2328,...Ch. 1 - Identifying Sampling Techniques In Exercises 2328,...Ch. 1 - Identifying Sampling Techniques In Exercises 2328,...Ch. 1 - Identifying Sampling Techniques In Exercises 2328,...Ch. 1 - Identifying Sampling Techniques In Exercises 2328,...Ch. 1 - You want to know the favorite spring break...Ch. 1 - A study of the dietary habits of 359,264 Korean...Ch. 1 - Determine whether each number describes a...Ch. 1 - Determine whether the data are qualitative or...Ch. 1 - Determine the level of measurement of the data...Ch. 1 - Determine whether the study is an observational...Ch. 1 - An experiment is performed to test the effects of...Ch. 1 - Identify the sampling technique used in each...Ch. 1 - Which technique used in Exercise 7 could lead to a...Ch. 1 - Determine whether you would take a census or use a...Ch. 1 - Determine whether each number describes a...Ch. 1 - Specify the minimum, maximum, and number of...Ch. 1 - Use the applet to repeat Example 3 on page 21....Ch. 1 - Identify the sampling technique used, and discuss...Ch. 1 - Determine whether the data are qualitative or...Ch. 1 - Determine whether the survey question is biased....Ch. 1 - Researchers surveyed 19,183 U.S. physicians,...Ch. 1 - When do you think smartphone payments will replace...Ch. 1 - Data Classification (a) What type of data do you...Ch. 1 - How They Did It When The Harris Poll did a similar...Ch. 1 - The SEC (Securities and Exchange Commission) is...Ch. 1 - A quality control department is testing 25...Ch. 1 - Consider the population of ten digits: 0, 1, 2, 3,...Ch. 1 - Consider the population of 41 whole numbers from 0...Ch. 1 - Use random numbers to simulate rolling a six-sided...Ch. 1 - Prob. 6TCh. 1 - Use random numbers to simulate tossing a coin 100...Ch. 1 - You tossed a coin 100 times and got 77 heads and...Ch. 1 - A political analyst would like to survey a sample...
Knowledge Booster


Learn more about
Need a deep-dive on the concept behind this application? Look no further. Learn more about this topic, statistics and related others by exploring similar questions and additional content below.Similar questions
- A pollster randomly selected four of 10 available people. Required: How many different groups of 4 are possible? What is the probability that a person is a member of a group? Note: Round your answer to 3 decimal places.arrow_forwardWind Mountain is an archaeological study area located in southwestern New Mexico. Potsherds are broken pieces of prehistoric Native American clay vessels. One type of painted ceramic vessel is called Mimbres classic black-on-white. At three different sites the number of such sherds was counted in local dwelling excavations. Test given. Site I Site II Site III 63 19 60 43 34 21 23 49 51 48 11 15 16 46 26 20 31 Find .arrow_forwardRothamsted Experimental Station (England) has studied wheat production since 1852. Each year many small plots of equal size but different soil/fertilizer conditions are planted with wheat. At the end of the growing season, the yield (in pounds) of the wheat on the plot is measured. Suppose for a random sample of years, one plot gave the following annual wheat production (in pounds): 4.46 4.21 4.40 4.81 2.81 2.90 4.93 3.54 4.16 4.48 3.26 4.74 4.97 4.02 4.91 2.59 Use a calculator to verify that the sample variance for this plot is . Another random sample of years for a second plot gave the following annual wheat production (in pounds): 3.89 3.81 3.95 4.07 4.01 3.73 4.02 3.78 3.72 3.96 3.62 3.76 4.02 3.73 3.94 4.03 Use a calculator to verify that the sample variance for this plot is . Suppose that we test the claim using that the population variance of annual wheat production for the first plot is larger…arrow_forward
- It is thought that prehistoric Native Americans did not take their best tools, pottery, and household items when they visited higher elevations for their summer camps. It is hypothesized that archaeological sites tend to lose their cultural identity and specific cultural affiliation as the elevation of the site increases. Let x be the elevation (in thousands of feet) for an archaeological site in the southwestern United States. Let y be the percentage of unidentified artifacts (no specific cultural affiliation) at a given elevation. Suppose that the following data were obtained for a collection of archaeological sites in New Mexico: x 5.50 6.00 6.75 7.00 7.75 y 37 38 92 70 99 Find the equation of the least squares line . Round a and b to three decimal places.arrow_forwardA fitness trainer wants to estimate the effect of fitness activities on muscle mass for different weight categories of club members. They choose the most popular fitness classes at the gym: yoga, circuit training, and high-intensity interval training (HIIT). Suppose that the weights of club members are separated into three levels: under 155 pounds, 155 – 200 pounds, and over 200 pounds. Draw a flow chart showing the design of this experiment.arrow_forwardThe systolic blood pressure of individuals is thought to be related to both age and weight. Let the systolic blood pressure, age, and weight be represented by the variables x1, x2, and x3, respectively. Suppose that Minitab was used to generate the following descriptive statistics, correlations, and regression analysis for a random sample of 15 individuals. Descriptive Statistics Variable N Mean Median TrMean StDev SE Mean x 1 15 154.14 154.34 154.14 3.842 0.992000 x 2 15 59.69 60.19 59.69 1.462 0.377487 x 3 15 205.55 204.75 205.55 4.558 1.176871 Variable Minimum Maximum Q1 Q3 x 1 125 178 141.803 167.244 x 2 41 80 47.754 78.415 x 3 126 240 140.395 224.008 Correlations (Pearson) x 1 x 2 x 2 0.892 x 3 0.839 0.567 Regression Analysis The regression equation is x 1 = 0.883 + 1.257x2 + 0.871x3 Predictor Coef StDev T P Constant 0.883 0.635 1.39 0.095 x 2 1.257 0.635 1.98 0.036 x 3 0.871 0.419 2.08 0.030 S = 0.428 R-sq = 92.7 %…arrow_forward
- According to health professionals, a person’s weight is expected to increase with age. To examine that statement, a nutritionist collected data from 11 random females from different age categories between the ages of 21 and 43. In the following table, x is the age of a person and y is the weight in pounds. x, age 21 24 27 29 31 33 35 38 40 42 43 y, weight in lb 121.4 122.3 130.3 131.7 133.3 134.6 136.7 138.4 140.3 142.0 145.1 Select the correct graph of the least-squares line on a scatter diagram.arrow_forwardLet x be a random variable that represents the percentage of successful free throws a professional basketball player makes in a season. Let y be a random variable that represents the percentage of successful field goals a professional basketball player makes in a season. A random sample of n = 6 professional basketball players gave the following information. x 82 69 73 84 74 64 y 42 48 46 46 46 42 Verify that ∑x =446, ∑y =270, ∑x2 =33,442, ∑y2 =12,180, ∑xy =20,070, and r = 0, and find the critical value for a test using a 5% level of significance claiming that ρis not equal than zero. Round your answer to three decimal places.arrow_forwardLet x be a random variable that represents the percentage of successful free throws a professional basketball player makes in a season. Let y be a random variable that represents the percentage of successful field goals a professional basketball player makes in a season. A random sample of n = 6 professional basketball players gave the following information. x 75 72 75 81 74 81 y 46 39 42 47 49 50 Verify that Se ࣈ 3.591,a ࣈ –10.145, bࣈ0.729, and , and find the predicted percentage of successful field goals for a player with x= 88%successful free throws. Round your answer to the nearest tenth of a percentarrow_forward
- An editor wants to analyze if there is a significant difference in the ratings of books in four different genres. Random samples of book ratings were collected for four different genres. The editor recorded ratings in a 0 to 10 scale in the following table. Fiction Novel Biography Science&Technology 8.5 8.4 6.2 9.1 5.3 5.3 5.5 4.3 7.7 4.2 7.0 9.7 5.1 9.8 9.3 5.2 6.9 8.6 6.7 7.9 4.8 7.1 6.9 8.4 Shall we reject or not reject the claim that there are no differences among the population means of book ratings for the different genres? Use.arrow_forwardPeggy conducted a study to identify the randomness of rainy days in fall. For 15 days, she recorded whether it rained that day or not. They denoted a rainy day with the letter R, a day without rain with the letter N. R N N R R N N R R N N R R R R Test the sequence for randomness. Use .arrow_forwardConsider the grades for the math and history exams for 10 students on a scale from 0 to 12 in the following table. Student Math History 1 4 8 2 5 9 3 7 9 4 12 10 5 10 8 6 8 5 7 9 6 8 9 6 9 11 9 10 7 10 Compute the Spearman correlation coefficient. Round your answer to three decimal places.arrow_forward
arrow_back_ios
SEE MORE QUESTIONS
arrow_forward_ios
Recommended textbooks for you
 Glencoe Algebra 1, Student Edition, 9780079039897...AlgebraISBN:9780079039897Author:CarterPublisher:McGraw Hill
 Big Ideas Math A Bridge To Success Algebra 1: Stu...AlgebraISBN:9781680331141Author:HOUGHTON MIFFLIN HARCOURTPublisher:Houghton Mifflin Harcourt
 Holt Mcdougal Larson Pre-algebra: Student Edition...AlgebraISBN:9780547587776Author:HOLT MCDOUGALPublisher:HOLT MCDOUGAL
Glencoe Algebra 1, Student Edition, 9780079039897...
Algebra
ISBN:9780079039897
Author:Carter
Publisher:McGraw Hill
Big Ideas Math A Bridge To Success Algebra 1: Stu...
Algebra
ISBN:9781680331141
Author:HOUGHTON MIFFLIN HARCOURT
Publisher:Houghton Mifflin Harcourt
Holt Mcdougal Larson Pre-algebra: Student Edition...
Algebra
ISBN:9780547587776
Author:HOLT MCDOUGAL
Publisher:HOLT MCDOUGAL
Hypothesis Testing using Confidence Interval Approach; Author: BUM2413 Applied Statistics UMP;https://www.youtube.com/watch?v=Hq1l3e9pLyY;License: Standard YouTube License, CC-BY
Hypothesis Testing - Difference of Two Means - Student's -Distribution & Normal Distribution; Author: The Organic Chemistry Tutor;https://www.youtube.com/watch?v=UcZwyzwWU7o;License: Standard Youtube License