
Elementary Statistics: Picturing the World (7th Edition)
7th Edition
ISBN: 9780134683416
Author: Ron Larson, Betsy Farber
Publisher: PEARSON
expand_more
expand_more
format_list_bulleted
Videos
Textbook Question
Chapter 1.2, Problem 20E
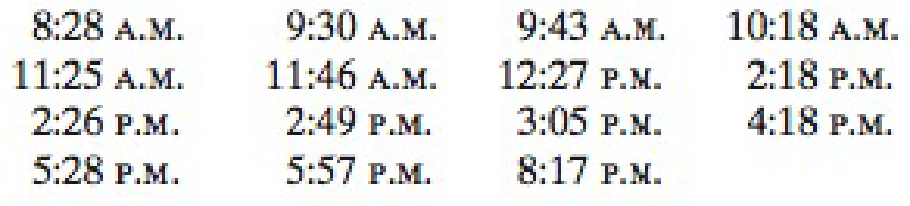
Classifying Data By Level In Exercises 15–20, determine the level of measurement of the data set. Explain your reasoning.
20. Cell Phone The times of the day when a person checks his or her cell phone are listed.
Graphical Analysis In Exercises 21–24, determine the level of measurement of the data listed on the horizontal and vertical axes in the figure.
Expert Solution & Answer

Trending nowThis is a popular solution!

Students have asked these similar questions
The following data represent total ventilation measured in liters of air per minute per square meter of body area for two independent (and randomly chosen) samples.
Analyze these data using the appropriate non-parametric hypothesis test
each column represents before & after measurements on the same individual. Analyze with the appropriate non-parametric hypothesis test for a paired design.
Should you be confident in applying your regression equation to estimate the heart rate of a python at 35°C? Why or why not?
Chapter 1 Solutions
Elementary Statistics: Picturing the World (7th Edition)
Ch. 1.1 - In a survey of 1501 ninth to twelfth graders in...Ch. 1.1 - Determine whether each number describes a...Ch. 1.1 - A study of 1000 U.S. adults found that when they...Ch. 1.1 - How is a sample related to a population?Ch. 1.1 - Why is a sample used more often than a population?Ch. 1.1 - What is the difference between a parameter and a...Ch. 1.1 - What are the two main branches of statistics?Ch. 1.1 - True or False? In Exercises 510, determine whether...Ch. 1.1 - True or False? In Exercises 510, determine whether...Ch. 1.1 - True or False? In Exercises 510, determine whether...
Ch. 1.1 - True or False? In Exercises 510, determine whether...Ch. 1.1 - True or False? In Exercises 510, determine whether...Ch. 1.1 - True or False? In Exercises 510, determine whether...Ch. 1.1 - Classifying a Data Set In Exercises 1120,...Ch. 1.1 - Classifying a Data Set In Exercises 1120,...Ch. 1.1 - Classifying a Data Set In Exercises 1120,...Ch. 1.1 - Classifying a Data Set In Exercises 1120,...Ch. 1.1 - Classifying a Data Set In Exercises 1120,...Ch. 1.1 - Classifying a Data Set In Exercises 1120,...Ch. 1.1 - Classifying a Data Set In Exercises 1120,...Ch. 1.1 - Classifying a Data Set In Exercises 1120,...Ch. 1.1 - Classifying a Data Set In Exercises 1120,...Ch. 1.1 - Classifying a Data Set In Exercises 1120,...Ch. 1.1 - Graphical Analysis In Exercises 2124, use the Venn...Ch. 1.1 - Graphical Analysis In Exercises 2124, use the Venn...Ch. 1.1 - Graphical Analysis In Exercises 2124, use the Venn...Ch. 1.1 - Graphical Analysis In Exercises 2124, use the Venn...Ch. 1.1 - Identifying Data Sets In Exercises 2534, identify...Ch. 1.1 - Identifying Data Sets In Exercises 2534, identify...Ch. 1.1 - Identifying Data Sets In Exercises 2534, identify...Ch. 1.1 - Identifying Data Sets In Exercises 2534, identify...Ch. 1.1 - Identifying Data Sets In Exercises 2534, identify...Ch. 1.1 - Identifying Data Sets In Exercises 2534, identify...Ch. 1.1 - Identifying Data Sets In Exercises 2534, identify...Ch. 1.1 - Identifying Data Sets In Exercises 2534, identify...Ch. 1.1 - Identifying Data Sets In Exercises 2534, identify...Ch. 1.1 - Identifying Data Sets In Exercises 2534, identify...Ch. 1.1 - Distinguishing Between a Parameter and a Statistic...Ch. 1.1 - Distinguishing Between a Parameter and a Statistic...Ch. 1.1 - Distinguishing Between a Parameter and a Statistic...Ch. 1.1 - Distinguishing Between a Parameter and a Statistic...Ch. 1.1 - Distinguishing Between a Parameter and a Statistic...Ch. 1.1 - Distinguishing Between a Parameter and a Statistic...Ch. 1.1 - Distinguishing Between a Parameter and a Statistic...Ch. 1.1 - Distinguishing Between a Parameter and a Statistic...Ch. 1.1 - Descriptive and Inferential Statistics Which part...Ch. 1.1 - Descriptive and Inferential Statistics Which part...Ch. 1.1 - Exercise and Cognitive Ability A study of 876...Ch. 1.1 - Increase in Obesity Rates A study shows that the...Ch. 1.1 - Sleep and Student Achievement A study shows the...Ch. 1.2 - The populations of several U.S. cities are shown...Ch. 1.2 - For each data set. determine whether the data are...Ch. 1.2 - For each data set, determine whether the data are...Ch. 1.2 - Name each level of measurement for which data can...Ch. 1.2 - Name each level of measurement for which data can...Ch. 1.2 - True or False? In Exercises 36, determine whether...Ch. 1.2 - True or False? In Exercises 36, determine whether...Ch. 1.2 - True or False? In Exercises 36, determine whether...Ch. 1.2 - True or False? In Exercises 36, determine whether...Ch. 1.2 - Classifying Data by Type In Exercises 714,...Ch. 1.2 - Classifying Data by Type In Exercises 714,...Ch. 1.2 - Classifying Data by Type In Exercises 714,...Ch. 1.2 - Classifying Data by Type In Exercises 714,...Ch. 1.2 - Classifying Data by Type In Exercises 714,...Ch. 1.2 - Classifying Data by Type In Exercises 714,...Ch. 1.2 - Classifying Data by Type In Exercises 714,...Ch. 1.2 - Classifying Data by Type In Exercises 714,...Ch. 1.2 - Classifying Data By Level In Exercises 1520,...Ch. 1.2 - Classifying Data By Level In Exercises 1520,...Ch. 1.2 - Classifying Data By Level In Exercises 1520,...Ch. 1.2 - Classifying Data By Level In Exercises 1520,...Ch. 1.2 - Classifying Data By Level In Exercises 1520,...Ch. 1.2 - Classifying Data By Level In Exercises 1520,...Ch. 1.2 - Graphical Analysis In Exercises 2124, determine...Ch. 1.2 - Graphical Analysis In Exercises 2124, determine...Ch. 1.2 - Graphical Analysis In Exercises 2124, determine...Ch. 1.2 - Graphical Analysis In Exercises 2124, determine...Ch. 1.2 - The items below appear on a physician's intake...Ch. 1.2 - Graphical Analysis In Exercises 2124, determine...Ch. 1.2 - Classifying Data by Type and Level In Exercises...Ch. 1.2 - Classifying Data by Type and Level In Exercises...Ch. 1.2 - Classifying Data by Type and Level In Exercises...Ch. 1.2 - Classifying Data by Type and Level In Exercises...Ch. 1.2 - Classifying Data by Type and Level In Exercises...Ch. 1.2 - Classifying Data by Type and Level In Exercises...Ch. 1.2 - Extending Concepts 33. Writing What is an inherent...Ch. 1.2 - Describe two examples of data sets for each of the...Ch. 1.2 - For more than 50 years. The Harris Poll has...Ch. 1.2 - Reputations of 10 Companies in the U.S. (Source:...Ch. 1.2 - Reputations of 10 Companies in the U.S. (Source:...Ch. 1.2 - Reputations of 10 Companies in the U.S. (Source:...Ch. 1.2 - Reputations of 10 Companies in the U.S. (Source:...Ch. 1.2 - For more than 50 years. The Harris Poll has...Ch. 1.3 - The Pennsylvania Game Commission conducted a study...Ch. 1.3 - Prob. 2TYCh. 1.3 - A company employs 79 people. Choose a simple...Ch. 1.3 - You want to determine the opinions of students...Ch. 1.3 - What is the difference between an observational...Ch. 1.3 - What is the difference between a census and a...Ch. 1.3 - What is the difference between a random sample and...Ch. 1.3 - What is replication in an experiment? Why is...Ch. 1.3 - True or False? In Exercises 510, determine whether...Ch. 1.3 - True or False? In Exercises 510, determine whether...Ch. 1.3 - True or False? In Exercises 510, determine whether...Ch. 1.3 - True or False? In Exercises 510, determine whether...Ch. 1.3 - True or False? In Exercises 510, determine whether...Ch. 1.3 - True or False? In Exercises 510, determine whether...Ch. 1.3 - Distinguishing Between an Observational Study and...Ch. 1.3 - Distinguishing Between an Observational Study and...Ch. 1.3 - Distinguishing Between an Observational Study and...Ch. 1.3 - Distinguishing Between an Observational Study and...Ch. 1.3 - Random Number Table Use the sixth row of Table 1...Ch. 1.3 - Random Number Table Use the tenth row of Table 1...Ch. 1.3 - Random Numbers In Exercises 17 and 18, use...Ch. 1.3 - Random Numbers In Exercises 17 and 18, use...Ch. 1.3 - Allergy Drug A pharmaceutical company wants to...Ch. 1.3 - Dietary Supplement Researchers in Germany tested...Ch. 1.3 - Sleep Deprivation A researcher wants to study the...Ch. 1.3 - Using a Simple Random Sample Volunteers for an...Ch. 1.3 - Identifying Sampling Techniques In Exercises 2328,...Ch. 1.3 - Identifying Sampling Techniques In Exercises 2328,...Ch. 1.3 - Identifying Sampling Techniques In Exercises 2328,...Ch. 1.3 - Identifying Sampling Techniques In Exercises 2328,...Ch. 1.3 - Identifying Sampling Techniques In Exercises 2328,...Ch. 1.3 - Identifying Sampling Techniques In Exercises 2328,...Ch. 1.3 - Choosing Between a Census and a Sampling In...Ch. 1.3 - Choosing Between a Census and a Sampling In...Ch. 1.3 - Recognizing a Biased Question In Exercises 3134,...Ch. 1.3 - Recognizing a Biased Question In Exercises 3134,...Ch. 1.3 - Recognizing a Biased Question In Exercises 3134,...Ch. 1.3 - Recognizing a Biased Question In Exercises 3134,...Ch. 1.3 - Open and Closed Questions Two types of survey...Ch. 1.3 - Natural Experiments Observational studies are...Ch. 1.3 - Prob. 1ACh. 1.3 - In Exercises 14, identify the population and the...Ch. 1 - In Exercises 14, identify the population and the...Ch. 1 - In Exercises 14, identify the population and the...Ch. 1 - In Exercises 58, determine whether the number...Ch. 1 - In Exercises 58, determine whether the number...Ch. 1 - In Exercises 58, determine whether the number...Ch. 1 - In Exercises 58, determine whether the number...Ch. 1 - Which part of the survey described in Exercise 3...Ch. 1 - Which part of the survey described in Exercise 4...Ch. 1 - In Exercises 1114, determine whether the data are...Ch. 1 - In Exercises 1114, determine whether the data are...Ch. 1 - In Exercises 1114, determine whether the data are...Ch. 1 - In Exercises 1114, determine whether the data are...Ch. 1 - In Exercises 1518, determine the level of...Ch. 1 - In Exercises 1518, determine the level of...Ch. 1 - In Exercises 1518, determine the level of...Ch. 1 - In Exercises 1518, determine the level of...Ch. 1 - In Exercises 19 and 20, determine whether the...Ch. 1 - In Exercises 19 and 20, determine whether the...Ch. 1 - In Exercises 21 and 22, two hundred students...Ch. 1 - In Exercises 21 and 22, two hundred students...Ch. 1 - Identifying Sampling Techniques In Exercises 2328,...Ch. 1 - Identifying Sampling Techniques In Exercises 2328,...Ch. 1 - Identifying Sampling Techniques In Exercises 2328,...Ch. 1 - Identifying Sampling Techniques In Exercises 2328,...Ch. 1 - Identifying Sampling Techniques In Exercises 2328,...Ch. 1 - Identifying Sampling Techniques In Exercises 2328,...Ch. 1 - You want to know the favorite spring break...Ch. 1 - A study of the dietary habits of 359,264 Korean...Ch. 1 - Determine whether each number describes a...Ch. 1 - Determine whether the data are qualitative or...Ch. 1 - Determine the level of measurement of the data...Ch. 1 - Determine whether the study is an observational...Ch. 1 - An experiment is performed to test the effects of...Ch. 1 - Identify the sampling technique used in each...Ch. 1 - Which technique used in Exercise 7 could lead to a...Ch. 1 - Determine whether you would take a census or use a...Ch. 1 - Determine whether each number describes a...Ch. 1 - Specify the minimum, maximum, and number of...Ch. 1 - Use the applet to repeat Example 3 on page 21....Ch. 1 - Identify the sampling technique used, and discuss...Ch. 1 - Determine whether the data are qualitative or...Ch. 1 - Determine whether the survey question is biased....Ch. 1 - Researchers surveyed 19,183 U.S. physicians,...Ch. 1 - When do you think smartphone payments will replace...Ch. 1 - Data Classification (a) What type of data do you...Ch. 1 - How They Did It When The Harris Poll did a similar...Ch. 1 - The SEC (Securities and Exchange Commission) is...Ch. 1 - A quality control department is testing 25...Ch. 1 - Consider the population of ten digits: 0, 1, 2, 3,...Ch. 1 - Consider the population of 41 whole numbers from 0...Ch. 1 - Use random numbers to simulate rolling a six-sided...Ch. 1 - Prob. 6TCh. 1 - Use random numbers to simulate tossing a coin 100...Ch. 1 - You tossed a coin 100 times and got 77 heads and...Ch. 1 - A political analyst would like to survey a sample...
Knowledge Booster


Learn more about
Need a deep-dive on the concept behind this application? Look no further. Learn more about this topic, statistics and related others by exploring similar questions and additional content below.Similar questions
- Given your fitted regression line, what would be the residual for snake #5 (10 C)?arrow_forwardCalculate the 95% confidence interval around your estimate of r using Fisher’s z-transformation. In your final answer, make sure to back-transform to the original units.arrow_forwardCalculate Pearson’s correlation coefficient (r) between temperature and heart rate.arrow_forward
- A researcher wishes to estimate, with 90% confidence, the population proportion of adults who support labeling legislation for genetically modified organisms (GMOs). Her estimate must be accurate within 4% of the true proportion. (a) No preliminary estimate is available. Find the minimum sample size needed. (b) Find the minimum sample size needed, using a prior study that found that 65% of the respondents said they support labeling legislation for GMOs. (c) Compare the results from parts (a) and (b). ... (a) What is the minimum sample size needed assuming that no prior information is available? n = (Round up to the nearest whole number as needed.)arrow_forwardThe table available below shows the costs per mile (in cents) for a sample of automobiles. At a = 0.05, can you conclude that at least one mean cost per mile is different from the others? Click on the icon to view the data table. Let Hss, HMS, HLS, Hsuv and Hмy represent the mean costs per mile for small sedans, medium sedans, large sedans, SUV 4WDs, and minivans respectively. What are the hypotheses for this test? OA. Ho: Not all the means are equal. Ha Hss HMS HLS HSUV HMV B. Ho Hss HMS HLS HSUV = μMV Ha: Hss *HMS *HLS*HSUV * HMV C. Ho Hss HMS HLS HSUV =μMV = = H: Not all the means are equal. D. Ho Hss HMS HLS HSUV HMV Ha Hss HMS HLS =HSUV = HMVarrow_forwardQuestion: A company launches two different marketing campaigns to promote the same product in two different regions. After one month, the company collects the sales data (in units sold) from both regions to compare the effectiveness of the campaigns. The company wants to determine whether there is a significant difference in the mean sales between the two regions. Perform a two sample T-test You can provide your answer by inserting a text box and the answer must include: Null hypothesis, Alternative hypothesis, Show answer (output table/summary table), and Conclusion based on the P value. (2 points = 0.5 x 4 Answers) Each of these is worth 0.5 points. However, showing the calculation is must. If calculation is missing, the whole answer won't get any credit.arrow_forward
arrow_back_ios
SEE MORE QUESTIONS
arrow_forward_ios
Recommended textbooks for you
 Big Ideas Math A Bridge To Success Algebra 1: Stu...AlgebraISBN:9781680331141Author:HOUGHTON MIFFLIN HARCOURTPublisher:Houghton Mifflin Harcourt
 Glencoe Algebra 1, Student Edition, 9780079039897...AlgebraISBN:9780079039897Author:CarterPublisher:McGraw Hill
 Holt Mcdougal Larson Pre-algebra: Student Edition...AlgebraISBN:9780547587776Author:HOLT MCDOUGALPublisher:HOLT MCDOUGAL
Big Ideas Math A Bridge To Success Algebra 1: Stu...
Algebra
ISBN:9781680331141
Author:HOUGHTON MIFFLIN HARCOURT
Publisher:Houghton Mifflin Harcourt
Glencoe Algebra 1, Student Edition, 9780079039897...
Algebra
ISBN:9780079039897
Author:Carter
Publisher:McGraw Hill
Holt Mcdougal Larson Pre-algebra: Student Edition...
Algebra
ISBN:9780547587776
Author:HOLT MCDOUGAL
Publisher:HOLT MCDOUGAL
How to make Frequency Distribution Table / Tally Marks and Frequency Distribution Table; Author: Reenu Math;https://www.youtube.com/watch?v=i_A6RiE8tLE;License: Standard YouTube License, CC-BY
Frequency distribution table in statistics; Author: Math and Science;https://www.youtube.com/watch?v=T7KYO76DoOE;License: Standard YouTube License, CC-BY
Frequency Distribution Table for Grouped/Continuous data | Math Dot Com; Author: Maths dotcom;https://www.youtube.com/watch?v=ErnccbXQOPY;License: Standard Youtube License