
INTRODUCTORY STATISTICS (LOOSELEAF)
3rd Edition
ISBN: 9780135163146
Author: Gould
Publisher: PEARSON
expand_more
expand_more
format_list_bulleted
Concept explainers
Videos
Textbook Question
Chapter 12, Problem 13SE
Expression of Feelings A 2017 Pew poll asked a random sample “Are men and women basically different in how they express feelings?” The results by gender (in percentages) are shown in the table below.
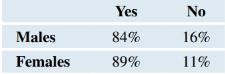
a. Assume the
b. The actual samples sizes for the survey were 2291 men and 2282 women. Repeat the hypothesis test using the actual sample sizes, reporting the test statistic, the p-value, and the conclusion.
c. Explain the difference in the results between parts a and b.
Expert Solution & Answer
Want to see the full answer?
Check out a sample textbook solution
Students have asked these similar questions
Techniques QUAT6221 2025 PT B...
TM
Tabudi Maphoru
Activities Assessments Class Progress lIE Library • Help v
The table below shows the prices (R) and quantities (kg) of rice, meat and potatoes items bought during 2013 and 2014:
2013
2014
P1Qo
PoQo
Q1Po P1Q1
Price
Ро
Quantity
Qo
Price
P1
Quantity
Q1
Rice
7
80
6
70
480
560
490
420
Meat
30
50
35
60
1 750
1 500
1 800
2 100
Potatoes
3
100
3
100
300
300
300
300
TOTAL
40
230
44
230
2 530
2 360
2 590
2 820
Instructions:
1 Corall dawn to tha bottom of thir ceraan urina se se tha haca nariad in archerca antarand cubmit
Q Search
ENG US
口X
2025/05
The table below indicates the number of years of experience of a sample of employees who work on a particular production line and the corresponding number of units of a good that each employee produced last month.
Years of Experience (x)
Number of Goods (y)
11
63
5
57
1
48
4
54
45
3
51
Q.1.1 By completing the table below and then applying the relevant formulae, determine the line of best fit for this bivariate data set.
Do NOT change the units for the variables.
X
y
X2
xy
Ex=
Ey=
EX2
EXY=
Q.1.2 Estimate the number of units of the good that would have been produced last month by an employee with 8 years of experience.
Q.1.3 Using your calculator, determine the coefficient of correlation for the data set.
Interpret your answer.
Q.1.4 Compute the coefficient of determination for the data set.
Interpret your answer.
Q.3.2 A sample of consumers was asked to name their favourite fruit. The results regarding the popularity of the different fruits are given in the following table.
Type of Fruit
Number of Consumers
Banana
25
Apple
20
Orange
5
TOTAL
50
Draw a bar chart to graphically illustrate the results given in the table.
Chapter 12 Solutions
INTRODUCTORY STATISTICS (LOOSELEAF)
Ch. 12 - Dairy Products and Muscle The following two...Ch. 12 - Coffee and Depression The following two headlines...Ch. 12 - Marijuana Use and Bone Density In a 2017 study...Ch. 12 - Prob. 4SECh. 12 - Prob. 5SECh. 12 - Prob. 6SECh. 12 - Prob. 7SECh. 12 - Smoking Cessation In a 2018 study reported in The...Ch. 12 - Prob. 9SECh. 12 - Prob. 10SE
Ch. 12 - Prob. 11SECh. 12 - Sugary Drinks and Brain Health An April 2017...Ch. 12 - Expression of Feelings A 2017 Pew poll asked a...Ch. 12 - Prob. 14SECh. 12 - Prob. 15SECh. 12 - SAT Prep and Power Suppose an SAT tutoring company...Ch. 12 - Brain Games (Example 2) Researchers are interested...Ch. 12 - A Smile a Day Smiling is a sign of a good mood,...Ch. 12 - Speed Skating Suits (Example 3) Speed skating is a...Ch. 12 - Flu Vaccines and Age Suppose you want to compare...Ch. 12 - Preventing Heart Attacks with Aspirin Suppose that...Ch. 12 - Prob. 22SECh. 12 - Dietary Improvement and Depression In a 2017...Ch. 12 - Prob. 24SECh. 12 - Reading Colored Paper (Example 4) Some people...Ch. 12 - Prob. 26SECh. 12 - Prob. 27SECh. 12 - Prob. 28SECh. 12 - Prob. 29SECh. 12 - Library Audio Books Suppose a college is deciding...Ch. 12 - Prob. 31SECh. 12 - Prob. 32SECh. 12 - Prob. 33SECh. 12 - Prob. 34SECh. 12 - Prob. 35SECh. 12 - Prob. 36SECh. 12 - Prob. 37SECh. 12 - Prob. 38SECh. 12 - Prob. 39SECh. 12 - Prob. 40SECh. 12 - Prob. 41SECh. 12 - Prob. 42SECh. 12 - Prob. 43SECh. 12 - Prob. 44SECh. 12 - Yoga Study Design Refer to exercise 12.43. How...Ch. 12 - Fish Consumption Study Design Refer to exercise...Ch. 12 - Prob. 47SECh. 12 - Prob. 48SECh. 12 - Alumni Donations The alumni office wishes to...Ch. 12 - Prob. 50SECh. 12 - Prob. 51SECh. 12 - Prob. 52SECh. 12 - For exercises 12.51-12.53, evaluate the study...Ch. 12 - Prob. 54SECh. 12 - Anesthesia Care and Adverse Postoperative Outcomes...Ch. 12 - Prob. 56SECh. 12 - Prob. 57SECh. 12 - Prob. 58SE
Knowledge Booster


Learn more about
Need a deep-dive on the concept behind this application? Look no further. Learn more about this topic, statistics and related others by exploring similar questions and additional content below.Similar questions
- Q.2.3 The probability that a randomly selected employee of Company Z is female is 0.75. The probability that an employee of the same company works in the Production department, given that the employee is female, is 0.25. What is the probability that a randomly selected employee of the company will be female and will work in the Production department? Q.2.4 There are twelve (12) teams participating in a pub quiz. What is the probability of correctly predicting the top three teams at the end of the competition, in the correct order? Give your final answer as a fraction in its simplest form.arrow_forwardQ.2.1 A bag contains 13 red and 9 green marbles. You are asked to select two (2) marbles from the bag. The first marble selected will not be placed back into the bag. Q.2.1.1 Construct a probability tree to indicate the various possible outcomes and their probabilities (as fractions). Q.2.1.2 What is the probability that the two selected marbles will be the same colour? Q.2.2 The following contingency table gives the results of a sample survey of South African male and female respondents with regard to their preferred brand of sports watch: PREFERRED BRAND OF SPORTS WATCH Samsung Apple Garmin TOTAL No. of Females 30 100 40 170 No. of Males 75 125 80 280 TOTAL 105 225 120 450 Q.2.2.1 What is the probability of randomly selecting a respondent from the sample who prefers Garmin? Q.2.2.2 What is the probability of randomly selecting a respondent from the sample who is not female? Q.2.2.3 What is the probability of randomly…arrow_forwardTest the claim that a student's pulse rate is different when taking a quiz than attending a regular class. The mean pulse rate difference is 2.7 with 10 students. Use a significance level of 0.005. Pulse rate difference(Quiz - Lecture) 2 -1 5 -8 1 20 15 -4 9 -12arrow_forward
- The following ordered data list shows the data speeds for cell phones used by a telephone company at an airport: A. Calculate the Measures of Central Tendency from the ungrouped data list. B. Group the data in an appropriate frequency table. C. Calculate the Measures of Central Tendency using the table in point B. D. Are there differences in the measurements obtained in A and C? Why (give at least one justified reason)? I leave the answers to A and B to resolve the remaining two. 0.8 1.4 1.8 1.9 3.2 3.6 4.5 4.5 4.6 6.2 6.5 7.7 7.9 9.9 10.2 10.3 10.9 11.1 11.1 11.6 11.8 12.0 13.1 13.5 13.7 14.1 14.2 14.7 15.0 15.1 15.5 15.8 16.0 17.5 18.2 20.2 21.1 21.5 22.2 22.4 23.1 24.5 25.7 28.5 34.6 38.5 43.0 55.6 71.3 77.8 A. Measures of Central Tendency We are to calculate: Mean, Median, Mode The data (already ordered) is: 0.8, 1.4, 1.8, 1.9, 3.2, 3.6, 4.5, 4.5, 4.6, 6.2, 6.5, 7.7, 7.9, 9.9, 10.2, 10.3, 10.9, 11.1, 11.1, 11.6, 11.8, 12.0, 13.1, 13.5, 13.7, 14.1, 14.2, 14.7, 15.0, 15.1, 15.5,…arrow_forwardPEER REPLY 1: Choose a classmate's Main Post. 1. Indicate a range of values for the independent variable (x) that is reasonable based on the data provided. 2. Explain what the predicted range of dependent values should be based on the range of independent values.arrow_forwardIn a company with 80 employees, 60 earn $10.00 per hour and 20 earn $13.00 per hour. Is this average hourly wage considered representative?arrow_forward
- The following is a list of questions answered correctly on an exam. Calculate the Measures of Central Tendency from the ungrouped data list. NUMBER OF QUESTIONS ANSWERED CORRECTLY ON AN APTITUDE EXAM 112 72 69 97 107 73 92 76 86 73 126 128 118 127 124 82 104 132 134 83 92 108 96 100 92 115 76 91 102 81 95 141 81 80 106 84 119 113 98 75 68 98 115 106 95 100 85 94 106 119arrow_forwardThe following ordered data list shows the data speeds for cell phones used by a telephone company at an airport: A. Calculate the Measures of Central Tendency using the table in point B. B. Are there differences in the measurements obtained in A and C? Why (give at least one justified reason)? 0.8 1.4 1.8 1.9 3.2 3.6 4.5 4.5 4.6 6.2 6.5 7.7 7.9 9.9 10.2 10.3 10.9 11.1 11.1 11.6 11.8 12.0 13.1 13.5 13.7 14.1 14.2 14.7 15.0 15.1 15.5 15.8 16.0 17.5 18.2 20.2 21.1 21.5 22.2 22.4 23.1 24.5 25.7 28.5 34.6 38.5 43.0 55.6 71.3 77.8arrow_forwardIn a company with 80 employees, 60 earn $10.00 per hour and 20 earn $13.00 per hour. a) Determine the average hourly wage. b) In part a), is the same answer obtained if the 60 employees have an average wage of $10.00 per hour? Prove your answer.arrow_forward
- The following ordered data list shows the data speeds for cell phones used by a telephone company at an airport: A. Calculate the Measures of Central Tendency from the ungrouped data list. B. Group the data in an appropriate frequency table. 0.8 1.4 1.8 1.9 3.2 3.6 4.5 4.5 4.6 6.2 6.5 7.7 7.9 9.9 10.2 10.3 10.9 11.1 11.1 11.6 11.8 12.0 13.1 13.5 13.7 14.1 14.2 14.7 15.0 15.1 15.5 15.8 16.0 17.5 18.2 20.2 21.1 21.5 22.2 22.4 23.1 24.5 25.7 28.5 34.6 38.5 43.0 55.6 71.3 77.8arrow_forwardBusinessarrow_forwardhttps://www.hawkeslearning.com/Statistics/dbs2/datasets.htmlarrow_forward
arrow_back_ios
SEE MORE QUESTIONS
arrow_forward_ios
Recommended textbooks for you
 Holt Mcdougal Larson Pre-algebra: Student Edition...AlgebraISBN:9780547587776Author:HOLT MCDOUGALPublisher:HOLT MCDOUGAL
 Big Ideas Math A Bridge To Success Algebra 1: Stu...AlgebraISBN:9781680331141Author:HOUGHTON MIFFLIN HARCOURTPublisher:Houghton Mifflin Harcourt
 Glencoe Algebra 1, Student Edition, 9780079039897...AlgebraISBN:9780079039897Author:CarterPublisher:McGraw Hill
Holt Mcdougal Larson Pre-algebra: Student Edition...
Algebra
ISBN:9780547587776
Author:HOLT MCDOUGAL
Publisher:HOLT MCDOUGAL
Big Ideas Math A Bridge To Success Algebra 1: Stu...
Algebra
ISBN:9781680331141
Author:HOUGHTON MIFFLIN HARCOURT
Publisher:Houghton Mifflin Harcourt
Glencoe Algebra 1, Student Edition, 9780079039897...
Algebra
ISBN:9780079039897
Author:Carter
Publisher:McGraw Hill
Hypothesis Testing - Solving Problems With Proportions; Author: The Organic Chemistry Tutor;https://www.youtube.com/watch?v=76VruarGn2Q;License: Standard YouTube License, CC-BY
Hypothesis Testing and Confidence Intervals (FRM Part 1 – Book 2 – Chapter 5); Author: Analystprep;https://www.youtube.com/watch?v=vth3yZIUlGQ;License: Standard YouTube License, CC-BY