
Basic Business Statistics Student Value Edition Plus NEW MyLab Statistics with Pearson eText -- Access Card Package (13th Edition)
13th Edition
ISBN: 9780133873641
Author: Mark L. Berenson, David M. Levine, Kathryn A. Szabat
Publisher: PEARSON
expand_more
expand_more
format_list_bulleted
Concept explainers
Videos
Textbook Question
Chapter 12, Problem 13PS
Use the following
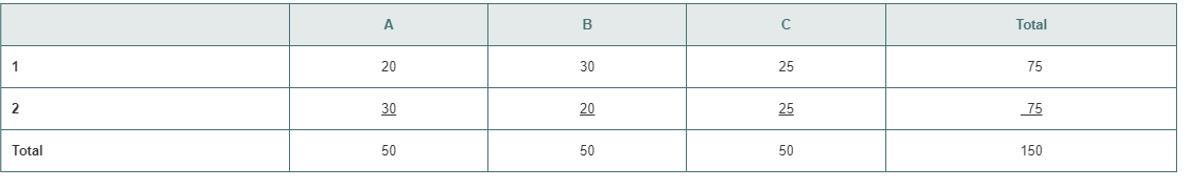
a. Compute the expected frequency for each cell.
b. Compute
Expert Solution & Answer
Want to see the full answer?
Check out a sample textbook solution
Students have asked these similar questions
Find the critical value for a left-tailed test using the F distribution with a 0.025, degrees of freedom in the numerator=12, and degrees of freedom in the
denominator = 50. A portion of the table of critical values of the F-distribution is provided.
Click the icon to view the partial table of critical values of the F-distribution.
What is the critical value?
(Round to two decimal places as needed.)
A retail store manager claims that the average daily sales of the store are $1,500.
You aim to test whether the actual average daily sales differ significantly from this claimed value.
You can provide your answer by inserting a text box and the answer must include:
Null hypothesis,
Alternative hypothesis,
Show answer (output table/summary table), and
Conclusion based on the P value.
Showing the calculation is a must. If calculation is missing,so please provide a step by step on the answers
Numerical answers in the yellow cells
Show all work
Chapter 12 Solutions
Basic Business Statistics Student Value Edition Plus NEW MyLab Statistics with Pearson eText -- Access Card Package (13th Edition)
Ch. 12 - Determine the critical value of 2 with 1 degree of...Ch. 12 - Determine the critical value of 2 with 1 degree of...Ch. 12 - Use the following contingency table: a. Compute...Ch. 12 - Use the following contingency table: a. Compare...Ch. 12 - Prob. 5PSCh. 12 - Prob. 6PSCh. 12 - Do males or females feel more tense or stressed...Ch. 12 - Prob. 8PSCh. 12 - Prob. 9PSCh. 12 - Prob. 10PS
Ch. 12 - Consider a contingency table, with two rows and...Ch. 12 - Use the following contingency table: a. Compute...Ch. 12 - Use the following contingency table: a. Compute...Ch. 12 - Prob. 14PSCh. 12 - Prob. 15PSCh. 12 - Social media users use a variety of devices to...Ch. 12 - Repeat (a) and (b) of Problem 12.16, assuming that...Ch. 12 - Prob. 18PSCh. 12 - Prob. 19PSCh. 12 - Prob. 20PSCh. 12 - Prob. 21PSCh. 12 - Prob. 22PSCh. 12 - Prob. 23PSCh. 12 - Prob. 24PSCh. 12 - Prob. 25PSCh. 12 - Prob. 26PSCh. 12 - Using Table E.6, determine the lower-and...Ch. 12 - Using Table E.6, determine the lower-tail critical...Ch. 12 - Prob. 29PSCh. 12 - Prob. 30PSCh. 12 - Prob. 31PSCh. 12 - The following information is available for two...Ch. 12 - From Problem 12.32 , at the 0.05 level of...Ch. 12 - In Problems 12.32 and 12.33, what is your...Ch. 12 - A vice president for marketing recruits 20 college...Ch. 12 - Prob. 36PSCh. 12 - Prob. 37PSCh. 12 - The management of a hotel has the business...Ch. 12 - The lengths of life (in hours) of a sample of 40...Ch. 12 - Brand valuations are critical to CEOs, financial...Ch. 12 - A bank with a branch located in a commercial...Ch. 12 - Prob. 42PSCh. 12 - Prob. 43PSCh. 12 - Prob. 44PSCh. 12 - A pet food company has the business objective of...Ch. 12 - A hospital conducted a study of the waiting time...Ch. 12 - Prob. 47PSCh. 12 - An advertising agency has been hired by a...Ch. 12 - Prob. 49PSCh. 12 - The more costly and time consuming it is to export...Ch. 12 - Prob. 51PSCh. 12 - Prob. 52PSCh. 12 - Prob. 53PSCh. 12 - Prob. 54PSCh. 12 - Prob. 55PSCh. 12 - Prob. 56PSCh. 12 - Prob. 57PSCh. 12 - Prob. 58PSCh. 12 - Prob. 59PS
Knowledge Booster


Learn more about
Need a deep-dive on the concept behind this application? Look no further. Learn more about this topic, statistics and related others by exploring similar questions and additional content below.Similar questions
- Show all workarrow_forwardplease find the answers for the yellows boxes using the information and the picture belowarrow_forwardA marketing agency wants to determine whether different advertising platforms generate significantly different levels of customer engagement. The agency measures the average number of daily clicks on ads for three platforms: Social Media, Search Engines, and Email Campaigns. The agency collects data on daily clicks for each platform over a 10-day period and wants to test whether there is a statistically significant difference in the mean number of daily clicks among these platforms. Conduct ANOVA test. You can provide your answer by inserting a text box and the answer must include: also please provide a step by on getting the answers in excel Null hypothesis, Alternative hypothesis, Show answer (output table/summary table), and Conclusion based on the P value.arrow_forward
- A company found that the daily sales revenue of its flagship product follows a normal distribution with a mean of $4500 and a standard deviation of $450. The company defines a "high-sales day" that is, any day with sales exceeding $4800. please provide a step by step on how to get the answers Q: What percentage of days can the company expect to have "high-sales days" or sales greater than $4800? Q: What is the sales revenue threshold for the bottom 10% of days? (please note that 10% refers to the probability/area under bell curve towards the lower tail of bell curve) Provide answers in the yellow cellsarrow_forwardBusiness Discussarrow_forwardThe following data represent total ventilation measured in liters of air per minute per square meter of body area for two independent (and randomly chosen) samples. Analyze these data using the appropriate non-parametric hypothesis testarrow_forward
arrow_back_ios
SEE MORE QUESTIONS
arrow_forward_ios
Recommended textbooks for you
 Glencoe Algebra 1, Student Edition, 9780079039897...AlgebraISBN:9780079039897Author:CarterPublisher:McGraw Hill
 Trigonometry (MindTap Course List)TrigonometryISBN:9781337278461Author:Ron LarsonPublisher:Cengage Learning
Glencoe Algebra 1, Student Edition, 9780079039897...
Algebra
ISBN:9780079039897
Author:Carter
Publisher:McGraw Hill
Trigonometry (MindTap Course List)
Trigonometry
ISBN:9781337278461
Author:Ron Larson
Publisher:Cengage Learning
Statistics 4.1 Point Estimators; Author: Dr. Jack L. Jackson II;https://www.youtube.com/watch?v=2MrI0J8XCEE;License: Standard YouTube License, CC-BY
Statistics 101: Point Estimators; Author: Brandon Foltz;https://www.youtube.com/watch?v=4v41z3HwLaM;License: Standard YouTube License, CC-BY
Central limit theorem; Author: 365 Data Science;https://www.youtube.com/watch?v=b5xQmk9veZ4;License: Standard YouTube License, CC-BY
Point Estimate Definition & Example; Author: Prof. Essa;https://www.youtube.com/watch?v=OTVwtvQmSn0;License: Standard Youtube License
Point Estimation; Author: Vamsidhar Ambatipudi;https://www.youtube.com/watch?v=flqhlM2bZWc;License: Standard Youtube License