
Concept explainers
Videos
The bar graph shows that the fraction of U.S adults who use the Internet has continued to increase.
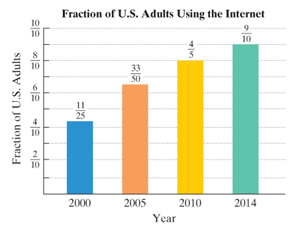
The data can be modeled by
a. Use the formula to find the fraction of adults who used the Internet in 2014.tions.
b. Use the least common denominator to compare the fraction of adults shown by the graph who used the Internet in 2014 with the fraction obtained by the mathematical model in part (a). Does the formula underestimate or overestimate the fraction shown by the graph? By how much?tions.
c. Use the formula to project the fraction of adults who will use the Internet in 2015.
Want to see the full answer?
Check out a sample textbook solution
Chapter 1 Solutions
Introductory Algebra for College Students (7th Edition)


- 1.2.19. Let and s be natural numbers. Let G be the simple graph with vertex set Vo... V„−1 such that v; ↔ v; if and only if |ji| Є (r,s). Prove that S has exactly k components, where k is the greatest common divisor of {n, r,s}.arrow_forwardQuestion 3 over a field K. In this question, MË(K) denotes the set of n × n matrices (a) Suppose that A Є Mn(K) is an invertible matrix. Is it always true that A is equivalent to A-¹? Justify your answer. (b) Let B be given by 8 B = 0 7 7 0 -7 7 Working over the field F2 with 2 elements, compute the rank of B as an element of M2(F2). (c) Let 1 C -1 1 [4] [6] and consider C as an element of M3(Q). Determine the minimal polynomial mc(x) and hence, or otherwise, show that C can not be diagonalised. [7] (d) Show that C in (c) considered as an element of M3(R) can be diagonalised. Write down all the eigenvalues. Show your working. [8]arrow_forwardR denotes the field of real numbers, Q denotes the field of rationals, and Fp denotes the field of p elements given by integers modulo p. You may refer to general results from lectures. Question 1 For each non-negative integer m, let R[x]m denote the vector space consisting of the polynomials in x with coefficients in R and of degree ≤ m. x²+2, V3 = 5. Prove that (V1, V2, V3) is a linearly independent (a) Let vi = x, V2 = list in R[x] 3. (b) Let V1, V2, V3 be as defined in (a). Find a vector v € R[×]3 such that (V1, V2, V3, V4) is a basis of R[x] 3. [8] [6] (c) Prove that the map ƒ from R[x] 2 to R[x]3 given by f(p(x)) = xp(x) — xp(0) is a linear map. [6] (d) Write down the matrix for the map ƒ defined in (c) with respect to the basis (2,2x + 1, x²) of R[x] 2 and the basis (1, x, x², x³) of R[x] 3. [5]arrow_forward
- Question 4 (a) The following matrices represent linear maps on R² with respect to an orthonormal basis: = [1/√5 2/√5 [2/√5 -1/√5] " [1/√5 2/√5] A = B = [2/√5 1/√5] 1 C = D = = = [ 1/3/5 2/35] 1/√5 2/√5 -2/√5 1/√5' For each of the matrices A, B, C, D, state whether it represents a self-adjoint linear map, an orthogonal linear map, both, or neither. (b) For the quadratic form q(x, y, z) = y² + 2xy +2yz over R, write down a linear change of variables to u, v, w such that q in these terms is in canonical form for Sylvester's Law of Inertia. [6] [4]arrow_forwardpart b pleasearrow_forwardQuestion 5 (a) Let a, b, c, d, e, ƒ Є K where K is a field. Suppose that the determinant of the matrix a cl |df equals 3 and the determinant of determinant of the matrix a+3b cl d+3e f ГЪ e [ c ] equals 2. Compute the [5] (b) Calculate the adjugate Adj (A) of the 2 × 2 matrix [1 2 A = over R. (c) Working over the field F3 with 3 elements, use row and column operations to put the matrix [6] 0123] A = 3210 into canonical form for equivalence and write down the canonical form. What is the rank of A as a matrix over F3? 4arrow_forward
- Question 2 In this question, V = Q4 and - U = {(x, y, z, w) EV | x+y2w+ z = 0}, W = {(x, y, z, w) € V | x − 2y + w − z = 0}, Z = {(x, y, z, w) € V | xyzw = 0}. (a) Determine which of U, W, Z are subspaces of V. Justify your answers. (b) Show that UW is a subspace of V and determine its dimension. (c) Is VU+W? Is V = UW? Justify your answers. [10] [7] '00'arrow_forwardTools Sign in Different masses and Indicated velocities Rotational inert > C C Chegg 39. The balls shown have different masses and speeds. Rank the following from greatest to least: 2.0 m/s 8.5 m/s 9.0 m/s 12.0 m/s 1.0 kg A 1.2 kg B 0.8 kg C 5.0 kg D C a. The momenta b. The impulses needed to stop the balls Solved 39. The balls shown have different masses and speeds. | Chegg.com Images may be subject to copyright. Learn More Share H Save Visit > quizlet.com%2FBoyE3qwOAUqXvw95Fgh5Rw.jpg&imgrefurl=https%3A%2F%2Fquizlet.com%2F529359992%2Fc. Xarrow_forwardSimplify the below expression. 3 - (-7)arrow_forward
- (6) ≤ a) Determine the following groups: Homz(Q, Z), Homz(Q, Q), Homz(Q/Z, Z) for n E N. Homz(Z/nZ, Q) b) Show for ME MR: HomR (R, M) = M.arrow_forward1. If f(x² + 1) = x + 5x² + 3, what is f(x² - 1)?arrow_forward2. What is the total length of the shortest path that goes from (0,4) to a point on the x-axis, then to a point on the line y = 6, then to (18.4)?arrow_forward
 Algebra and Trigonometry (MindTap Course List)AlgebraISBN:9781305071742Author:James Stewart, Lothar Redlin, Saleem WatsonPublisher:Cengage Learning
 Algebra: Structure And Method, Book 1AlgebraISBN:9780395977224Author:Richard G. Brown, Mary P. Dolciani, Robert H. Sorgenfrey, William L. ColePublisher:McDougal Littell
 College AlgebraAlgebraISBN:9781305115545Author:James Stewart, Lothar Redlin, Saleem WatsonPublisher:Cengage Learning
 College Algebra (MindTap Course List)AlgebraISBN:9781305652231Author:R. David Gustafson, Jeff HughesPublisher:Cengage Learning
 Mathematics For Machine TechnologyAdvanced MathISBN:9781337798310Author:Peterson, John.Publisher:Cengage Learning,
 Elementary Geometry for College StudentsGeometryISBN:9781285195698Author:Daniel C. Alexander, Geralyn M. KoeberleinPublisher:Cengage Learning