
(a)
Interpretation:
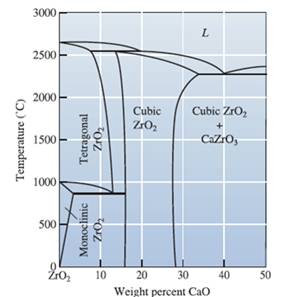
To determine eutectoid temperature, the composition of phase, amount of each phase of ZrO2-CaO.
Concept Introduction:
The graphical representation of the physical state of a substance which is under various conditions of pressure and temperature is known as phase diagram. A phase diagram has temperature on the x-axis and pressure on the y-axis. It is a type of chart which is used to demonstrate conditions at which
Answer to Problem 12.74P
The percentage of monoclinic and cubic is
Explanation of Solution
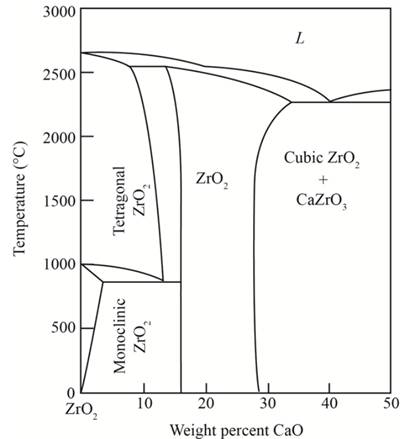
Sketch a horizontal line at
Therefore, from the graph mentioned above, the percentage of Monoclinic,
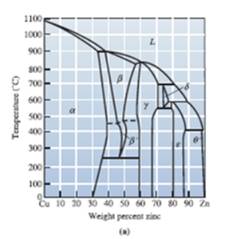
(b)
Interpretation:
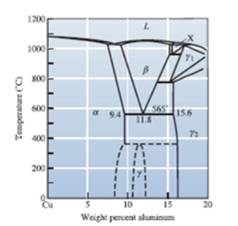
To determine the eutectoid temperature, composition and amount of phase in Cu-Al at
Concept Introduction:
The graphical representation of the physical state of a substance which is under various conditions of pressure and temperature is known as phase diagram. A phase diagram has temperature on the x-axis and pressure on the y-axis. It is a type of chart which is used to demonstrate conditions at which thermodynamically different phases takes place and coexist at equilibrium.
Answer to Problem 12.74P
The percentage of composition obtained are
Explanation of Solution
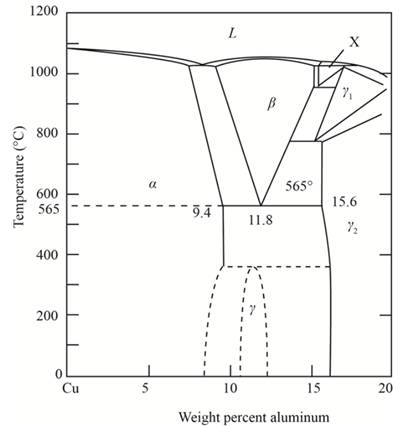
Draw a horizontal line that passes through
At this particular temperature, β phase transforms to a phase, as shown in the diagram above.
Therefore,
(c)
Interpretation:
To determine the eutectoid temperature, composition and amount of each phase in
Concept Introduction:
The graphical representation of the physical state of a substance which is under various conditions of pressure and temperature is known as phase diagram. A phase diagram has temperature on the x-axis and pressure on the y-axis. It is a type of chart which is used to demonstrate conditions at which thermodynamically different phases takes place and coexist at equilibrium.
Answer to Problem 12.74P
The percentage composition of a and that of
Explanation of Solution
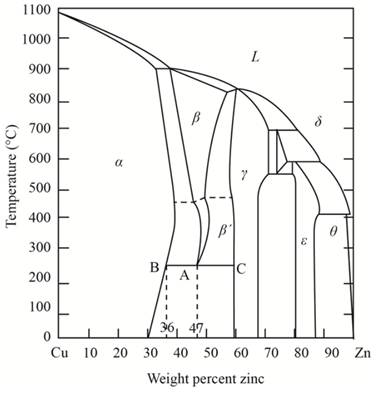
Draw a vertical line from 47 weight percent of Zinc that meets a point A. Further, from A draw the meeting point B and C, these points are in equilibrium with α and γ phases, weight percentages at these points are
Therefore,
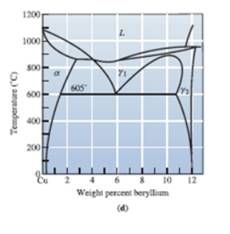
(d)
Interpretation:
To determine the eutectoid temperature amount and composition of each phase in Cu-Be.
Concept Introduction:
The graphical representation of the physical state of a substance which is under various conditions of pressure and temperature is known as phase diagram. A phase diagram has temperature on the x-axis and pressure on the y-axis. It is a type of chart which is used to demonstrate conditions at which thermodynamically different phases takes place and coexist at equilibrium.
Answer to Problem 12.74P
The percentage composition of the a phase and γ phase is obtained as 51.6% and 48.3%
Explanation of Solution
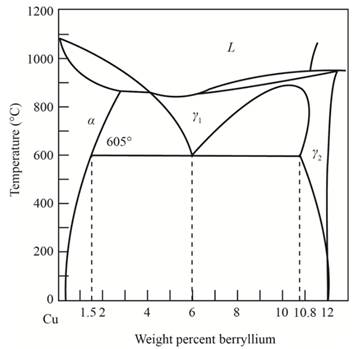
Sketch a vertical line from 6 weight percent of beryllium that meets a point A. Further, from A draw line meeting point B and C, these points are in equilibrium with phase
Want to see more full solutions like this?
Chapter 12 Solutions
Essentials Of Materials Science And Engineering

- It is the middle of a winter snowstorm. Sally and Jin take shelter under an overhang. The loading of the snow on top of the overhang is shown in the figure below. The overhang is attached to the wall at points A and B with pin supports. Another pin is at C. Determine the reactions of the pin supports at A and B. Express them in Cartesian vector form.arrow_forwardPlease answer all questions 1. Calculate the magnitude (in RMS) of the current through R1 2. Calculate the magnitude (in RMS) of the current through R2. Simulation 1. Construct the circuit in Figure 2 in the Circuit JS simulator. Note that transformers in Circuit JS may be unstable. It is suggested to draw them by clicking from the bottom left corner to the top right corner and refresh your simulation before taking a measurement. 2. Perform a simulation, displaying the voltage across the voltage source, the current through R1, and the current through R2 in a “stacked” scope. Display the RMS average for each trace. Include a screenshot. Analysis 1. Compare the simulation results for the currents through R1 and R2. What is the percentage difference between the calculated and simulated value for each? Comment on why there may be a discrepancy.arrow_forwardPlease answer all You and your crew have made it through the night and the day has brought more warmth. After searching the industrial site, you find an abundant amount of fuel to run the generators to keep you warm. You also find a memory card labelled “cure”, but your cell phone battery is dead. First things first, you will need to stay safe as the zombies continue to hunt you in your current location. The industrial site is surrounded by a metal chain-link fence. You decide you will electrify the fence to keep the zombies from scaling it. But the output voltage from the generators is not high enough to really deter them. You would like to apply around 10 kV to the fence (AC or DC, at that voltage it doesn’t really matter). You find a transformer that you can use but it only has a turn ratio of 10. You find some diodes and capacitors and construct the circuit shown in Figure 3 with the intention of hooking Vout to the fence. 1. Perform a circuit JS simulation, displaying…arrow_forward
- 2. A three-phase transformer connection Yy, 2000 kVA, 20000/6000 V has the relative short-circuit voltages Ecc = 7% and ERcc = 1.7%.It is known that when empty this transformer consumes a power Po = 12.24 kW. Calculate:a. Parameters Zcc, Rcc, Xcc, referring to the primary and EXcc.b. If the transformer is connected at rated voltage and feeds a load of 1800 kVA, fp = 0.8, calculate the line voltage at the secondary.c. The maximum apparent power, and the maximum efficiency fp = 0.8 inductive. Perform the exercise by the collaborators and without using artificial intelligence pleasearrow_forwardA nozzle is attached to a fire hose by a bolted flange as shown below. What is the force tending to tear apart that flange when the valve in the nozzle is closed?arrow_forward1. A three-phase transformer with Yd connection, 300 kVA, 12000/220 V, has been short-circuit tested on the high voltage side giving the following results: 750 V, 14.434 A, 10838 W.When the transformer is connected to nominal voltage without load it consumes 5400W. Calculate:to. Relative voltages of short circuit high voltage side: εcc, εRcc and εXcc.b. The voltage in the secondary when the transformer is connected to nominal voltage and feeds a load of 200 kW fp = 0.8 in delay.c. Apparent power of maximum efficiency and maximum efficiency with fp = 0.95 inductive. Please solve for one of the collaborators and without using artificial intelligencearrow_forward
- Find value of load resistance RL that can be connected to terminals a-b for maximum power transfer. Also calculate the maximum power that can be delivered to load RL.arrow_forwardI need help finding: -The axial deflection pipe in inches. -The lateral deflection of the beam in inches -The total deflection of the beam like structure in inches ?arrow_forwardA modulating signal f(t) is bandlimited to 5 kHz is sampled at a rate of 15000 samples/sec. The samples are quantized into 128 levels. Calculate the transmission bandwidth if the following modulation types are used for signal transmission: 4- ASK 5- 8-PSK 6- FSK with Af = 25 kHzarrow_forward
- A 2.0 m wide strip foundation carries a wall load of 350 kN/m in a clayey soil where y = 17 kN/m³, c' = 5.0 kN/m² and 23°. The foundation depth is 1.5 m. For o' = 23°: Nc = 18.05; N = 8.66; N = 8.20. Determine the factor of safety using the equation below. 1 qu = c' NcFcs Fed Fci +qNqFqs FqdFqi + ½ BN F√s 1 2 (Enter your answer to three significant figures.) s Fyd Fi FS =arrow_forwardDraw the Split-Phase Manchester code for the follow ng binary data: (1001010110)arrow_forward1.2 m BX B 70 kN.m y = 16 kN/m³ c' = 0 6'-30° Water table Ysat 19 kN/m³ c' 0 &' = 30° A square foundation is shown in the figure above. Use FS = 6, and determine the size of the foundation. Use the Prakash and Saran theory (see equation and figures below). Suppose that F = 450 kN. Qu = BL BL[c′Nc(e)Fcs(e) + qNg(e)Fcs(e) + · 1 YBN(e) F 2 7(e) Fra(e)] (Enter your answer to two significant figures.) B: m Na(e) 60 40- 20- e/B=0 0.1 0.2 0.3 .0.4 0 0 10 20 30 40 Friction angle, ' (deg) Figure 1 Variation of Na(e) with o' Ny(e) 60 40 20 e/B=0 0.3 0.1 0.2 0.4 0 0 10 20 30 40 Friction angle, ' (deg) Figure 2 Variation of Nye) with o'arrow_forward
 MATLAB: An Introduction with ApplicationsEngineeringISBN:9781119256830Author:Amos GilatPublisher:John Wiley & Sons Inc
 Essentials Of Materials Science And EngineeringEngineeringISBN:9781337385497Author:WRIGHT, Wendelin J.Publisher:Cengage,
 Industrial Motor ControlEngineeringISBN:9781133691808Author:Stephen HermanPublisher:Cengage Learning
 Basics Of Engineering EconomyEngineeringISBN:9780073376356Author:Leland Blank, Anthony TarquinPublisher:MCGRAW-HILL HIGHER EDUCATION
 Structural Steel Design (6th Edition)EngineeringISBN:9780134589657Author:Jack C. McCormac, Stephen F. CsernakPublisher:PEARSON
 Fundamentals of Materials Science and Engineering...EngineeringISBN:9781119175483Author:William D. Callister Jr., David G. RethwischPublisher:WILEY