
Concept explainers
Videos
(a)
The correct option that models the data in the graph showing critical reading SAT scores as a function of household income where C is a constant out of the following options.
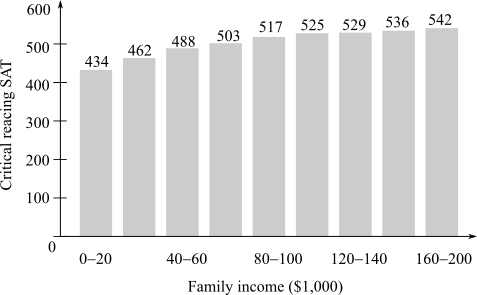
A)
B)
C)
D)
Where
(b)
The prediction for the effect on the critical reading SAT score of the student if the income of parents earning
(c)
Whether
Want to see the full answer?
Check out a sample textbook solution
Chapter 11 Solutions
Finite Mathematics and Applied Calculus (MindTap Course List)


- Find the accumulated amount A, if the principal P is invested at an interest rate of r per year for t years. (Round your answer to the nearest cent.) P = $13,000, r = 6%, t = 10, compounded quarterly A = $ 31902 Need Help? Read It Watch It Viewing Saved Work Revert to Last Response SUBMIT ANSWER O/6.66 Points] DETAILS MY NOTES TANAPCALC10 5.3.003. EVIOUS ANSWERS ASK YOUR TEACHER PRACTICE ANOTHER Find the accumulated amount A, if the principal P is invested at an interest rate of r per year for t years. (Round your answer to the nearest cent.) P = $140,000, r = 8%, t = 8, compounded monthly A = $259130.20 X Need Help? Read It Watch Itarrow_forwardFind the present value of $20,000 due in 3 years at the given rate of interest. (Round your answers to the nearest cent.) (a) 2%/year compounded monthly (b) 5%/year compounded daily $ Need Help? Read It Watch It SUBMIT ANSWER [-/6.66 Points] DETAILS MY NOTES TANAPCALC10 5.3.009. ASK YOUR TEACHER PRACTICE ANC Find the accumulated amount after 3 years if $4000 is invested at 3%/year compounded continuously. (Round your answer to the nearest cent.) Need Help? Read It Watch Itarrow_forwardFind the effective rate corresponding to the given nominal rate. (Round your answers to three decimal places.) (a) 9.5%/year compounded monthly % (b) 9.5%/year compounded daily % Need Help? Read It Watch It SUBMIT ANSWER -/6.66 Points] DETAILS MY NOTES TANAPCALC10 5.3.007. ASK YOUR TEACHE Find the present value of $90,000 due in 7 years at the given rate of interest. (Round your answers to the nearest cent.) (a) 9%/year compounded semiannually (b) 9%/year compounded quarterly LAarrow_forward
- Find the accumulated amount A, if the principal P is invested at an interest rate of r per year for t years. (Round your answer to the nearest cent.) P = $160,000, r = 7%, t = 4, compounded daily A = $211113.60 Need Help? Read It SUBMIT ANSWER ASK YOUR TEACHER PRACTICE ANOTHER --/6.66 Points] DETAILS MY NOTES TANAPCALC10 5.3.005. Find the effective rate corresponding to the given nominal rate. (Round your answers to three decimal places.) (a) 8%/year compounded semiannually % (b) 9%/year compounded quarterly %arrow_forwardFind the derivative of the function. g'(t) = 9t g(t) = In(t) (9ln(t) - 1) [In(t)] 2 × Need Help? Read It Watch Itarrow_forwardFind the accumulated amount A, if the principal P is invested at an interest rate of r per year for t years. (Round your answer to the nearest cent.) P = $3800, r = 4%, t = 10, compounded semiannually A = $ 5645.60 × Need Help? Read It SUBMIT ANSWER [3.33/6.66 Points] DETAILS MY NOTES REVIOUS ANSWERS ASK YOUR TEACHER TANAPCALC10 5.3.001.EP. PRACTICE ANOTHER Consider the following where the principal P is invested at an interest rate of r per year for t years. P = $3,100, r = 4%, t = 10, compounded semiannually Determine m, the number of conversion periods per year. 2 Find the accumulated amount A (in dollars). (Round your answer to the nearest cent.) A = $ 4604.44arrow_forward
- Force with 800 N and 400 N are acting on a machine part at 30° and 60°, respectively with a positive x axis, Draw the diagram representing this situationarrow_forwardI forgot to mention to you to solve question 1 and 2. Can you solve it using all data that given in the pict i given and can you teach me about that.arrow_forwardexam review please help!arrow_forward
 College AlgebraAlgebraISBN:9781305115545Author:James Stewart, Lothar Redlin, Saleem WatsonPublisher:Cengage Learning
 Functions and Change: A Modeling Approach to Coll...AlgebraISBN:9781337111348Author:Bruce Crauder, Benny Evans, Alan NoellPublisher:Cengage Learning
 Algebra & Trigonometry with Analytic GeometryAlgebraISBN:9781133382119Author:SwokowskiPublisher:Cengage
 Algebra and Trigonometry (MindTap Course List)AlgebraISBN:9781305071742Author:James Stewart, Lothar Redlin, Saleem WatsonPublisher:Cengage Learning
 Glencoe Algebra 1, Student Edition, 9780079039897...AlgebraISBN:9780079039897Author:CarterPublisher:McGraw Hill